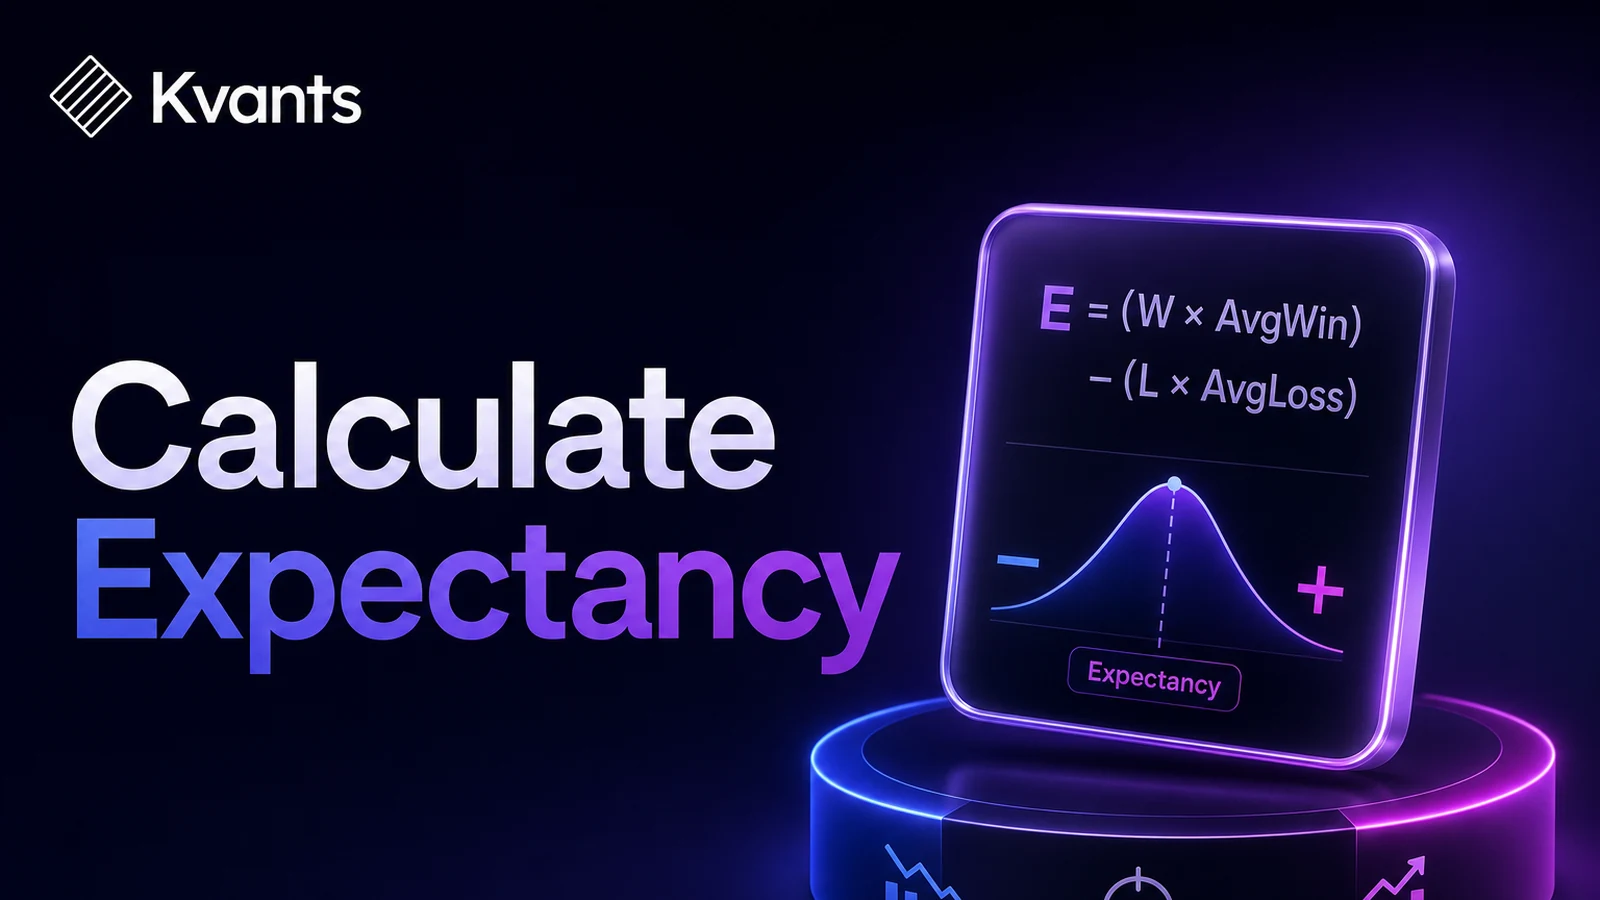
Learn how to calculate trading expectancy in dollars or R, interpret the result, identify misleading estimates, and test whether an apparent edge is robust.
Quick Answer
Trading expectancy is the average amount a strategy gains or loses per trade over a defined sample. Calculate it by multiplying the probability of a winning trade by the average win, then subtracting the probability of a losing trade multiplied by the average loss. A positive result suggests the tested rules had a positive average outcome, but it does not prove that the edge will persist. Costs, outliers, sample size, changing market conditions, and backtest assumptions can all make expectancy look stronger than it is.
Key Takeaways
- Expectancy combines win rate and payoff size into one average outcome per trade.
- Measure outcomes after commissions, fees, slippage, funding, and other relevant costs.
- Expressing expectancy in R makes results easier to compare across trades with different position sizes.
- A positive estimate can depend on a few exceptional winners or one favorable market regime.
- Evaluate expectancy by regime, time period, direction, and out-of-sample segment—not only across the full backtest.
- Expectancy describes an average, not the order of returns or the drawdown required to realize them.
What Trading Expectancy Measures
Trading expectancy estimates the average outcome produced each time a defined strategy takes a trade. The basic formula is:
Expectancy = (win probability × average win) − (loss probability × average loss)
Average loss is entered as a positive magnitude in this version of the formula. If losses are already recorded as negative numbers, add the weighted loss instead of subtracting it.
For example, suppose a strategy wins 45% of its trades. Its average winner is $200 and its average loser is $120:
Expectancy = (0.45 × $200) − (0.55 × $120) = $24 per trade
That does not mean the next trade should make $24. It means the historical sample produced an arithmetic average of $24 per trade under the assumptions used.
Expectancy is more informative than win rate by itself. A strategy can win frequently and still have negative expectancy if occasional losses are much larger than its winners. Conversely, a strategy can lose more often than it wins and still have positive expectancy if its winners are sufficiently large.
Expectancy also has limits. Two strategies can have the same expectancy but very different drawdowns, holding periods, trade frequencies, return distributions, and operational demands. It should therefore be treated as one part of strategy evaluation rather than a complete verdict.
Calculating Trading Expectancy in R
Dollar expectancy becomes difficult to compare when account size, instrument volatility, or position size changes. R-multiples provide a normalized alternative.
One R is the amount initially risked on a trade. If a trade risks $150 and closes with a $300 net gain, its result is +2R. If it loses the planned $150, it is −1R. A $75 loss is −0.5R.
The formula remains the same:
Expectancy in R = (win probability × average winning R) − (loss probability × average losing R)
When scratch trades exist, include them in the total trade count. Their contribution is zero, although any transaction costs should still be reflected in their final result.
Using R has several advantages:
- Trades with different dollar risk can be compared on the same scale.
- Position-size changes are less likely to distort strategy analysis.
- Planned risk can be compared with realized losses.
- Expectancy can be translated into a rough dollar figure using the intended risk per trade.
That last translation requires caution. If estimated expectancy is +0.15R and planned risk is $100, the arithmetic equivalent is $15 per trade. It is not a promise, cash-flow forecast, or guarantee that future trades will reproduce the sample.
Worked Example: From Trade Log to Expectancy
Consider a 50-trade sample with the following net results:
| Outcome | Number of Trades | Probability | Average Result | Weighted Contribution |
|---|---|---|---|---|
| Winners | 20 | 40% | +1.6R | +0.640R |
| Losers | 28 | 56% | −0.8R | −0.448R |
| Scratch trades | 2 | 4% | 0R | 0R |
The estimated expectancy is:
0.640R − 0.448R = +0.192R per trade
The strategy has only a 40% win rate, yet the sample has positive expectancy because the average winner is twice the size of the average loser.
Now suppose the results were recorded before costs and each trade incurs an average cost of 0.05R. Net expectancy would fall to:
0.192R − 0.05R = +0.142R per trade
This difference matters for strategies that trade frequently or target small price moves. Costs should ideally be deducted from each individual trade before calculating win rate, average win, and average loss. That allows a small gross winner that becomes a net loser to be classified correctly.
The example still does not establish robustness. The next questions are whether the 20 winners were broadly distributed, whether one trade generated most of the profits, and whether the result survives other periods and realistic execution assumptions.
A backtest's equity curve and trade-by-trade log.
A Step-by-Step Trading Expectancy Workflow
1. Define one strategy version
Do not combine trades from changing entry, exit, and sizing rules. Record the exact strategy version, instrument universe, timeframe, session, and test dates. Otherwise, the resulting expectancy describes a mixture rather than a repeatable process.
2. Calculate net trade outcomes
Include all costs the strategy could reasonably face. Depending on the market, these may include commissions, exchange fees, spread, slippage, borrow costs, or funding. Avoid applying one optimistic cost assumption to every instrument and market condition.
3. Normalize each result
Record both net currency outcome and R-multiple where possible. Use the risk defined at entry, not a revised risk amount created after the trade moved against the position.
If a strategy has no predefined stop or risk amount, calculate currency or percentage expectancy instead. Do not invent an R value that was not part of the rules.
4. Inspect the distribution
Calculate win rate, average win, average loss, median outcome, largest winners, and largest losses. The median helps reveal whether a positive mean depends on a small number of unusually large gains.
Also inspect the trade list directly. A strategy with +0.2R expectancy derived almost entirely from one +12R trade deserves more skepticism than one whose gains are distributed across many trades.
5. Segment the result
Break expectancy down by variables that were defined before analysis, such as:
- Long versus short trades
- High- versus low-volatility periods
- Instrument or asset group
- Trading session or time of day
- Entry setup
- Calendar period
- In-sample versus out-of-sample data
Segmentation can reveal where the strategy has historically worked, but excessive slicing creates false discoveries. Treat new patterns found during analysis as hypotheses requiring fresh tests.
6. Stress the assumptions
Recalculate expectancy with less favorable fills, higher costs, delayed entries, and plausible exit slippage. If a small change makes the result negative, the estimated edge may be too fragile to use.
For parameterized rules, inspect nearby settings rather than only the strongest result. A broad region of similar outcomes is generally more credible than one isolated peak.
7. Evaluate stability over time
Plot rolling expectancy over sequential groups of trades or fixed calendar windows. The purpose is not to demand identical performance in every window. It is to identify whether the full-sample average conceals prolonged deterioration, regime dependence, or a result concentrated in one period.
Failure Modes That Make Expectancy Misleading
Using gross rather than net outcomes
Small theoretical edges can disappear after realistic trading costs. This is especially important when turnover is high or liquidity varies.
Ignoring oversized losses
If the test assumes every stop fills exactly at its level, average loss may be understated. Gaps, thin order books, and fast markets can produce losses beyond the intended 1R.
Treating more trades as independent evidence
A large trade count is not automatically diverse. Hundreds of signals from correlated instruments during the same market move may reflect one repeated exposure.
Pooling incompatible regimes
A positive full-period expectancy can hide negative results in recent data or in specific volatility conditions. The aggregate remains useful, but it should not be the only view.
Selecting the strongest parameter result
Testing many combinations and reporting only the winner introduces selection bias. Parameter sweeps should be used to assess stability, not merely to locate the highest historical expectancy.
Confusing expectancy with risk capacity
A positive average does not show whether a trader can tolerate the strategy’s losing streaks or drawdowns. Position sizing must account for adverse sequences, not just the average trade.
A strategy laid out end to end in the Kvants editor.
Testing Expectancy With Kvants
Once the trading rules are objective, Kvants Studio can turn a plain-English strategy idea into editable, auditable logic and run it on NautilusTrader’s event-driven backtesting engine.
Expectancy can then be examined as part of a broader research process rather than as a standalone headline. Parameter sweeps can show whether the result survives nearby settings. Walk-forward testing can separate rule development from later evaluation, while crisis-stress validation can expose sensitivity to unusually difficult periods.
The trade list and strategy logic still require review. A testing engine cannot decide whether the original hypothesis is economically sensible or whether the supplied assumptions represent future execution. Traders can consult the Kvants documentation when defining a research workflow, then move a strategy into controlled paper or live use only if its risks and limitations are understood.
Kvants audits that the engine runs the strategy you configured.
Frequently Asked Questions
What is a good trading expectancy?
There is no universal threshold. A useful expectancy must be positive after costs and sufficiently large to remain positive under reasonable stress assumptions. Its value also depends on trade frequency, drawdown, capacity, execution risk, and stability across unseen data.
Is expectancy the same as profit factor?
No. Expectancy is the average net outcome per trade. Profit factor is gross profit divided by gross loss. Both summarize historical results, but neither describes the sequence of trades or guarantees future performance.
Can a strategy have positive expectancy with a low win rate?
Yes. A low-win-rate strategy can have positive expectancy when its average winner is large enough relative to its average loser. The trade-off may be longer losing streaks, which should be considered when setting position size.
How many trades are needed to calculate expectancy?
Expectancy can be calculated from any completed sample, but a small sample produces an unstable estimate. There is no universally sufficient trade count because reliability also depends on outcome variability, outliers, market diversity, and signal correlation. Report the sample size and keep testing on new data.
Should scratch trades count in the calculation?
Yes. Include them in the total number of trades and record their actual net result. A nominal breakeven exit may still be a small loss after fees and slippage.
Does positive expectancy mean a strategy is ready to trade?
No. It is only one requirement. The strategy should also be checked for data errors, look-ahead bias, realistic execution, parameter sensitivity, regime dependence, drawdowns, and out-of-sample stability.
Risk Note
This article is educational and is not investment advice. Trading involves risk, and a positive historical expectancy can weaken or disappear as markets and execution conditions change. Backtested performance does not guarantee future results. Kvants is a research tool, not an investment adviser, and does not guarantee performance.