Learn how to backtest volume profile strategies by defining profile ranges, timing levels correctly, modeling fills, and controlling data and selection bias.
Quick Answer
Volume profile backtesting starts by fixing the profile range, price-bin method, signal timing, order behavior, exits, and risk rules before examining results. Every level must use only the volume information available when the trade decision would have occurred. The main limitation is data quality: standard OHLCV bars do not show exactly how volume was distributed across prices within each bar. If trade-level or suitable lower-timeframe data is unavailable, use a documented approximation and interpret the results as an approximation—not an exact reconstruction.
Key Takeaways
- Select profile boundaries mechanically rather than anchoring them after seeing a price move.
- Treat the POC, value area, HVNs, and LVNs as calculated references, not automatic trade signals.
- Never use a final session profile for a decision made before that session ended.
- Document bin size, session boundaries, value-area logic, and volume-allocation assumptions.
- Model orders, costs, delays, and ambiguous intrabar sequences conservatively.
- Compare the profile rule with a simpler baseline and validate it on later data.
What a Volume Profile Backtest Measures
A volume profile organizes recorded trading volume by price. Its common components include:
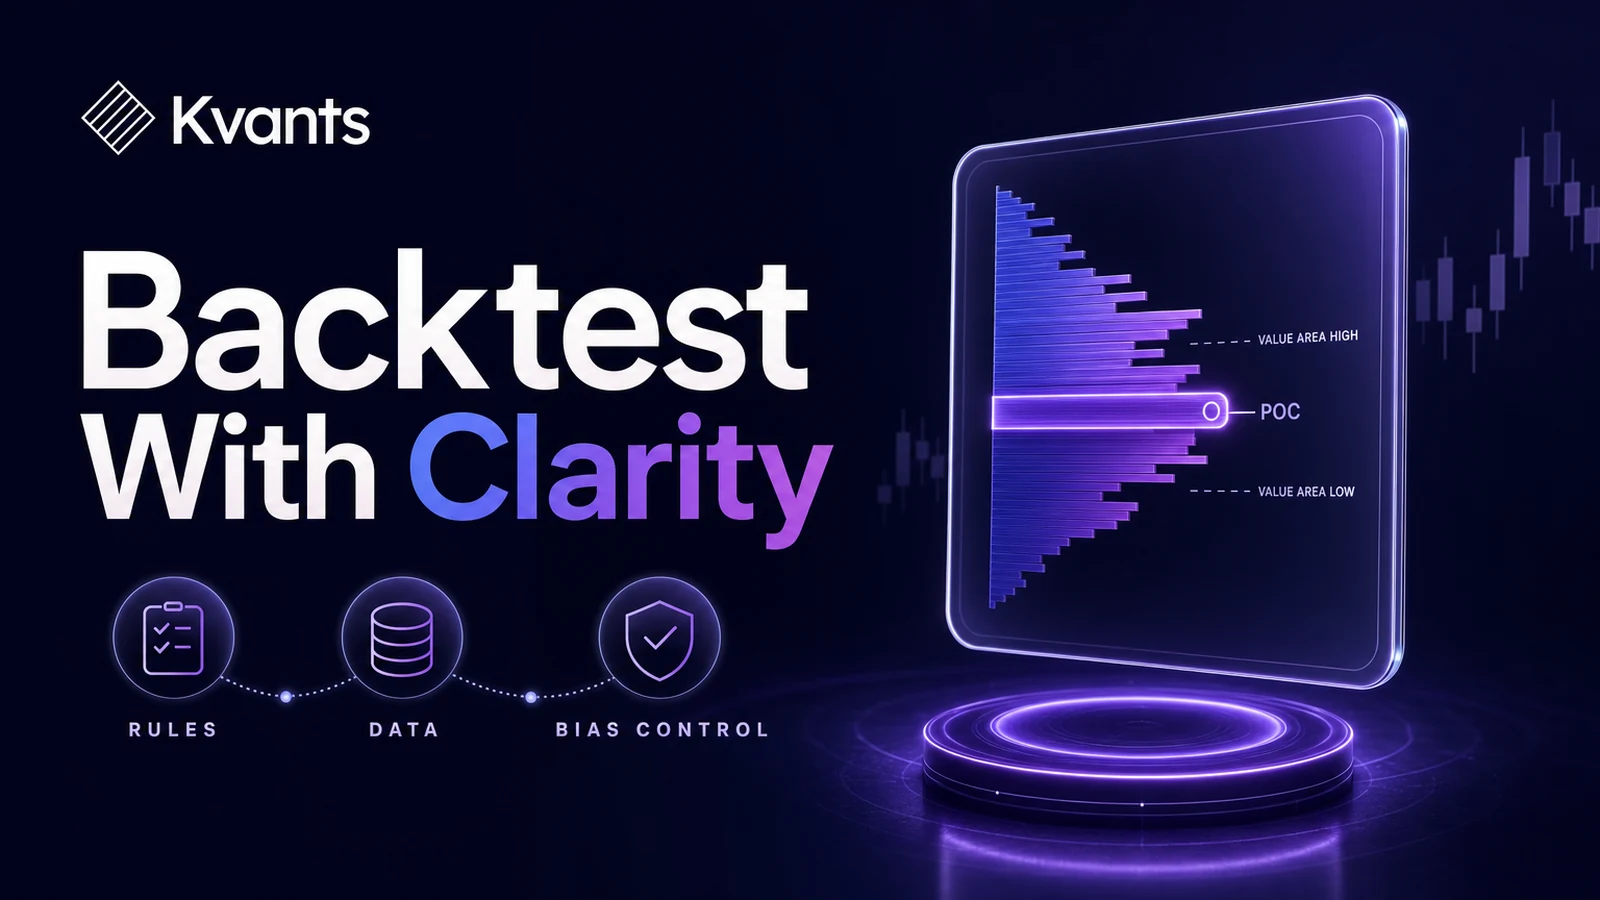
- Point of control (POC): the price bin containing the most volume within the selected range.
- Value area: a collection of bins containing a chosen share of total profile volume, calculated with a specified method.
- Value area high and low: the upper and lower boundaries of that area.
- High-volume nodes (HVNs): regions with relatively concentrated volume.
- Low-volume nodes (LVNs): regions with relatively sparse volume.
These calculations describe where historical activity occurred. They do not prove that a level will act as support or resistance, identify who traded there, or predict the next move.
A useful backtest therefore starts with a narrow question. For example:
After a session opens below the prior value area, does a close back above the prior value area low produce different outcomes from the same pattern around the prior session midpoint?
That hypothesis identifies a reference period, event, direction, and baseline. “Buy the POC” is not complete enough to test.
A Volume Profile Backtesting Workflow
1. Define the profile range mechanically
Specify which trades or bars contribute to each profile. Reproducible choices include the previous completed session, a rolling number of completed bars, or a calendar week with fixed boundaries.
For an initial test, the previous completed session is easier to audit than a visually anchored fixed range. Its boundaries are known before the next session begins.
Also document the exchange calendar, time zone, session hours, and treatment of extended-hours activity. Including or excluding overnight trading can materially change the levels.
2. Define how volume is assigned to price
Trade-level data can assign each transaction’s volume to its recorded price. OHLCV candles provide only total bar volume, not the volume traded at every price between the high and low.
A candle-based test therefore needs an explicit approximation, such as assigning volume to the closing-price bin or distributing it across the candle’s range. Neither method recovers the actual transaction sequence.
Your specification should also define:
- Price-bin width or row count
- Alignment with the instrument’s price increment
- Value-area percentage and expansion algorithm
- Treatment of ties between equal-volume bins
- Handling of missing or corrected records
These are model assumptions. Do not silently select whichever combination produces the most attractive historical result.
3. Enforce information timing
A prior session’s completed profile can be referenced during the next session. The current session’s final profile cannot be used for a trade supposedly placed halfway through that session.
If you use a developing profile, recalculate it from information available at each decision point. Store the POC and value-area boundaries as they existed at signal time. Do not replace those historical values with final end-of-session levels later.
You must also define when an order becomes eligible. If confirmation occurs at a five-minute close, an entry at that same closing price may be unrealistic. A next-bar order or an event-based execution rule is usually easier to defend.
4. Convert the setup into complete rules
A testable volume profile strategy must answer:
- Which market and session are traded?
- Which completed or developing profile supplies the levels?
- What qualifies as a touch, rejection, reclaim, or breakout?
- Is confirmation based on an intrabar event or completed bar?
- Which order type is submitted, and when?
- When is an unfilled order canceled?
- Where are the stop, target, and time exit?
- How is position size determined?
- How many entries are allowed per session?
For example, define a bullish reclaim as “a completed bar trades below the prior value area low and closes above it.” Requiring two closes above the boundary would be a different strategy and should be tested separately.
5. Model execution and trading costs
A candle touching a profile level does not prove that a limit order filled there. The same candle may also contain the entry, stop, and target without revealing their sequence.
Include commissions, spread, slippage, execution delay, minimum price increments, and market-specific fees where relevant. If the available data cannot resolve an intrabar sequence, use a conservative rule or more granular data rather than assuming the favorable path.
6. Compare against a simpler baseline
A strong historical result does not show that volume profile caused the outcome. Trend exposure, opening gaps, time of day, or the exit rule may explain it.
Hold the rest of the strategy constant and replace the profile level with a simpler reference, such as the prior close, session midpoint, rolling high or low, or moving average. Compare net expectancy after costs, drawdown, trade count, and stability across periods.
The important question is whether the profile condition adds useful, repeatable information—not whether it wins one in-sample comparison.
A backtest's equity curve and trade-by-trade log.
Worked Example: Prior Value Area Reclaim
Consider a hypothetical long-only intraday research specification.
Profile rules: Build the profile from the previous regular session using fixed price bins. Calculate its POC and value area with one documented algorithm, then freeze the levels before the next session opens.
Entry rules: The new session opens below the prior value area low. A completed five-minute bar trades below that boundary and closes above it. Submit an entry at the next bar’s open, with no more than one entry per session.
Risk and exit rules: Set the initial stop a predefined distance below the signal bar. Calculate size from the entry-to-stop distance and a fixed risk limit. Exit at the prior POC, the stop, or a specified session time—whichever occurs first.
This is a test specification, not a recommendation. Compare it with identical gap-and-reclaim rules using the prior session midpoint. Then test nearby bin sizes, higher cost assumptions, different periods, and chronological holdout data.
Common Volume Profile Backtesting Failure Modes
Choosing the range after seeing the reversal
A fixed-range profile anchored to the most convenient historical swing embeds hindsight. Use predetermined session boundaries or an event rule that could have selected the same range in real time.
Using final levels before they existed
A developing POC or value area can move throughout the session. Using the final version for earlier trades introduces future information and can create signals that were never available.
Treating OHLCV as exact volume-at-price data
Candle volume does not reveal where every transaction occurred. State the allocation method and check whether conclusions survive finer data or other reasonable approximations.
Searching too many configurations
Testing many ranges, bin widths, value-area settings, confirmations, and exits creates a large hidden trial count. Constrain the search, preserve untouched chronological data, and look for stability across nearby settings.
Assuming the POC must hold
A POC is the highest-volume bin under a particular calculation. Price may reverse there, cross it, or consolidate around it. Each interpretation is a hypothesis requiring evidence.
A strategy laid out end to end in the Kvants editor.
Testing Volume Profile Rules With Kvants
Begin with a plain-English specification covering the profile range, data assumptions, signal timing, orders, risk controls, and exits. Kvants Studio turns plain-English trading ideas into editable, auditable strategy logic, helping expose vague conditions such as “strong rejection” or “important volume node.”
When the available stock or crypto data supports the chosen calculation, the rules can be evaluated on NautilusTrader’s event-driven engine. Constrained parameter sweeps can examine a limited set of bin widths or confirmation thresholds. Walk-forward and crisis-stress validation can then test sensitivity to time periods and market conditions.
No research platform can reconstruct price-level volume that is absent from the source data. Verify the data schema, calculation method, and generated strategy logic before interpreting results. The Kvants documentation explains the strategy workflow, while the Kvants blog provides additional validation guides.
Kvants audits that the engine runs the strategy you configured.
Frequently Asked Questions
Can I backtest volume profile with OHLCV candles?
Yes, but the profile will rely on an approximation unless the dataset contains volume at individual prices. Document how candle volume is assigned to bins and test whether reasonable alternative methods change the conclusion.
Should I use a fixed or developing volume profile?
Use the type that matches your hypothesis. A prior-period fixed profile is simpler because its inputs are complete before the next period. A developing profile reflects current activity but must be recalculated at every decision point.
What is the best volume profile bin size?
There is no universal setting. Narrow bins can be noisy and sensitive to data quality, while wide bins can hide structure. Select a defensible range and test whether the result remains stable across nearby values.
How do I prevent look-ahead bias in a POC strategy?
Calculate the POC only from data available before the signal. Freeze completed-period levels. For developing profiles, preserve each historical POC as it appeared at that time instead of replacing it with the final value.
Which results should I review?
Review expectancy after costs, drawdown, trade count, holding time, adverse and favorable excursion, and performance across chronological periods. Compare the rules with a simpler baseline and inspect sensitivity to execution and data assumptions.
Risk Note
This article is educational and is not investment advice. Volume profile levels and historical tests cannot predict future market behavior. Backtested performance does not guarantee future results. Data limitations, liquidity, fees, slippage, model assumptions, and changing conditions can materially affect outcomes. Kvants is a research tool, not an investment adviser, and does not guarantee performance.