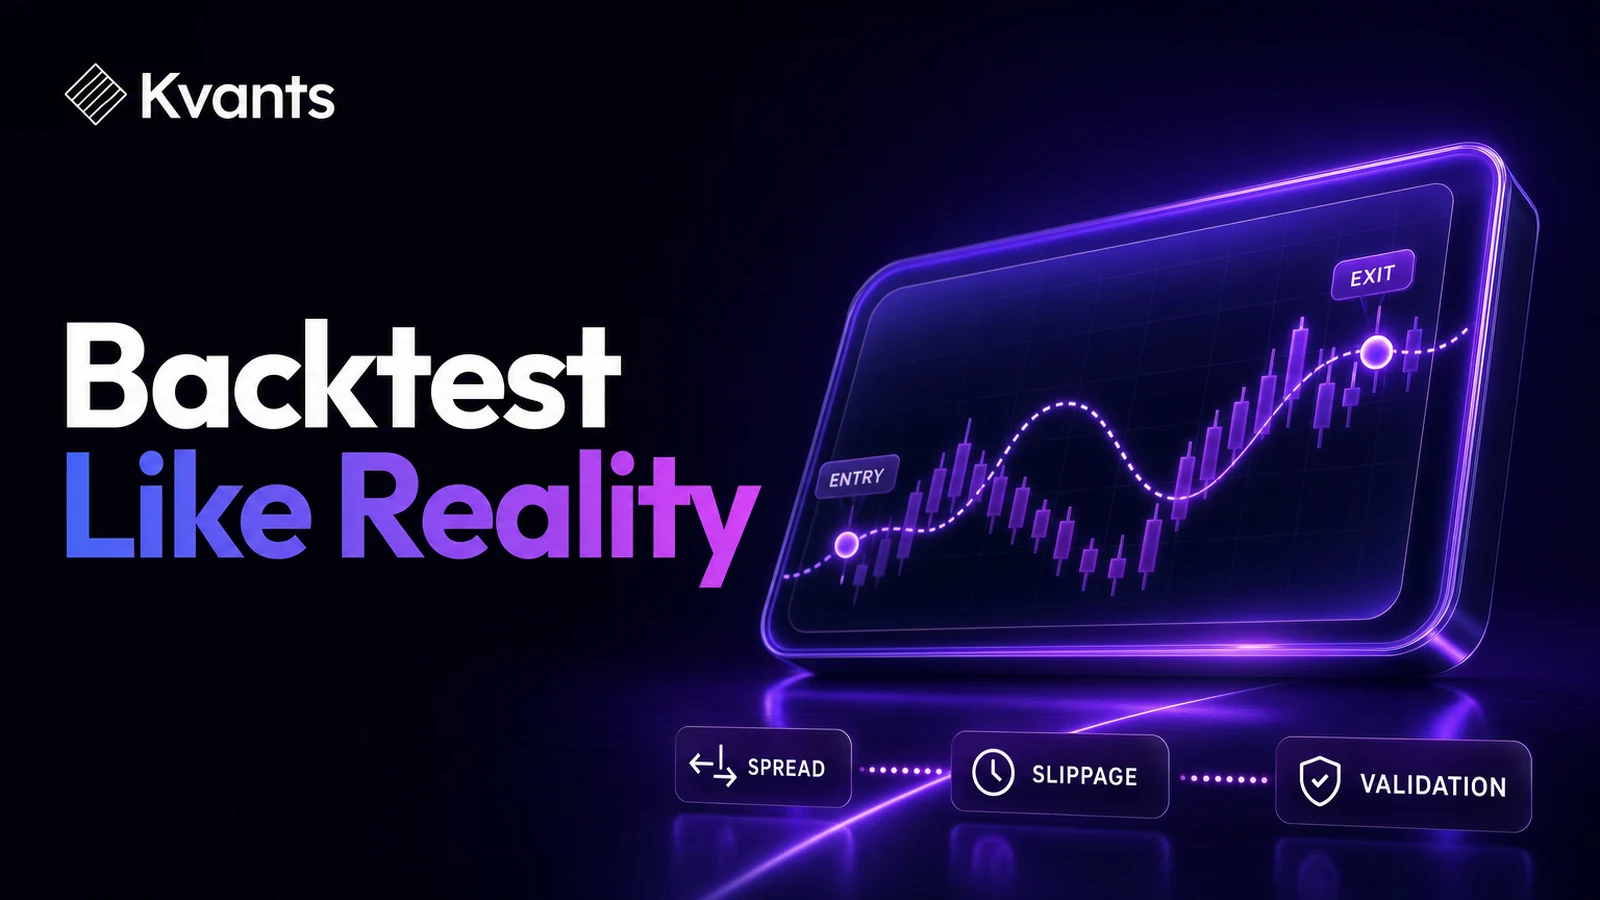
Learn how to build a scalping strategy backtest that accounts for spread, slippage, intrabar sequencing, trading costs, and validation outside the development sample.
Quick Answer
A credible scalping strategy backtest needs objective entry and exit rules, sufficiently detailed market data, conservative fill assumptions, and every material trading cost. Test the strategy across different sessions and market conditions, then reserve unseen data for validation. The main limitation is execution realism: when the expected profit per trade is only a few ticks, spread, slippage, latency, and queue position can determine whether an apparent edge survives. A bar-based test cannot reliably validate a setup that depends on precise order-book behavior.
Key Takeaways
- Define the setup so two independent testers would identify the same trades.
- Match data resolution to the strategy’s decision and holding horizons.
- Model spread, fees, slippage, rejected fills, and adverse price movement.
- Resolve cases where the stop and target occur within the same bar.
- Validate on unseen periods and stress assumptions rather than trusting one optimized result.
- Use paper trading to investigate execution gaps that historical data cannot reproduce.
Why Scalping Backtests Are Unusually Fragile
Scalping targets short price movements and usually holds positions for seconds or minutes. That creates a narrow margin between a strategy’s gross result and its net result after execution costs.
Suppose a trade captures a $0.10 move in 100 shares. The gross gain is $10. If the round trip loses $0.02 per share to spread and slippage, execution has consumed $2 before commissions or other fees. A small change in the fill assumption can therefore alter the conclusion of the test.
Longer-horizon strategies are not immune to costs, but those costs may represent a smaller share of the intended move. For a scalper, they are often part of the core hypothesis.
Three issues deserve particular attention:
- Data resolution: A five-minute candle can conceal many possible paths between its open, high, low, and close.
- Fill realism: Touching an entry price does not prove that an order would have filled there.
- Market impact and latency: Historical testing may not capture the delay between observing a signal, sending an order, and receiving a fill.
A backtest can still be useful, but its claims must remain within what the available data can support.
How to Build a Scalping Strategy Backtest
1. Freeze the market and session definition
Start by specifying the instrument universe, trading venue, timezone, session, and dates. Avoid testing an undefined idea such as “buy strong momentum.”
A usable specification might state:
- Trade liquid stocks above a defined price and volume threshold.
- Evaluate signals only during a fixed session window.
- Hold no positions outside that window.
- Exclude or separately tag scheduled-event periods.
- Permit only one open position per instrument.
These constraints determine which opportunities the strategy could actually have observed. They also prevent a test from quietly mixing overnight, opening-session, and low-liquidity behavior.
Universe selection must use information available at the time. Building today’s stock list and applying it to past years can create survivorship bias.
2. Convert the visual setup into explicit rules
Every important term needs a measurable definition. If the setup requires a “tight consolidation,” define its maximum range, duration, volume behavior, and relationship to a reference level.
Write rules for:
- Signal calculation
- Entry trigger
- Order type
- Initial stop
- Profit-taking logic
- Maximum holding time
- Position sizing
- Re-entry and cooldown behavior
- End-of-session liquidation
For example, replace “enter when momentum resumes” with a rule such as: enter when price trades above the highest high of the previous five completed bars, provided those bars remain within a specified range and current relative volume exceeds a predefined threshold.
This is only an example of rule construction, not a recommendation. The thresholds should come from a documented hypothesis and must be validated rather than selected solely because they maximize historical results.
3. Use data that can represent the decision
The data must be at least as detailed as the event being modeled. A strategy making decisions within a one-minute bar should not assume that the bar’s closing summary reveals the true event sequence.
Ask four questions:
- Was the signal known before the simulated order was submitted?
- Can the data show whether entry occurred before the stop or target?
- Does it contain bid and ask information, or only traded prices?
- Are missing bars, session boundaries, and corporate actions handled correctly?
Tick or quote data can improve sequencing and spread estimates, but greater resolution does not automatically make a test realistic. If the strategy depends on queue priority, fleeting liquidity, or changes deep in the order book, even trade-and-quote data may be insufficient.
4. Model orders instead of assigning ideal prices
A common error is to generate a signal and fill the trade at the same historical price. That assumes immediate recognition, submission, and execution with no adverse movement.
A more defensible model separates these events:
- Market information arrives.
- The strategy evaluates the completed information.
- An order is created.
- The order reaches the simulated market.
- The fill occurs only if the order conditions are satisfied.
For market orders, apply an estimate for spread and slippage. For limit orders, do not assume a fill merely because the market touched the limit. Consider requiring price to trade through the level, applying a probabilistic fill model where justified, or testing both optimistic and conservative assumptions.
The conservative case is usually more informative. If the strategy works only when every limit order fills at the front of the queue, the result is not robust.
5. Include all material costs
Calculate performance after:
- Bid-ask spread
- Commission
- Exchange, regulatory, or contract fees where applicable
- Slippage
- Borrow costs and availability for short positions, when relevant
- Funding or other venue-specific charges for leveraged crypto products
Avoid applying one cost estimate to instruments with very different liquidity. Costs may also change by time of day and volatility regime.
Run a cost sensitivity test. For example, compare the base assumption with slippage increased by one tick and then two ticks. The purpose is not to predict an exact future cost. It is to determine whether a small execution deterioration destroys the result.
6. Define intrabar conflict rules
If one bar contains both the stop and profit target, the test must decide which occurred first. Using the favorable outcome creates hidden optimism.
Possible treatments include:
- Use lower-resolution data to reconstruct the sequence.
- Assume the adverse outcome occurred first.
- Mark the trade ambiguous and report it separately.
- Run best-case and worst-case bounds.
The selected policy should be stated in the research notes. Never let the backtest engine choose the profitable path silently.
7. Validate outside the development sample
After the initial rules are frozen, evaluate them on data that was not used to design or tune the strategy. Examine more than net profit.
Review:
- Number of trades
- Net expectancy per trade
- Win rate and average win-to-loss ratio
- Maximum drawdown
- Consecutive losses
- Results by instrument, session segment, and market regime
- Sensitivity to costs and nearby parameter values
Walk-forward analysis can repeat this process over time: parameters are selected using a historical training window and then evaluated on the next unseen window. This does not eliminate overfitting, but it exposes strategies that require continual hindsight-driven tuning.
A backtest's equity curve and trade-by-trade log.
Worked Example: Testing a Short-Horizon Breakout
Consider a hypothetical long-only setup on liquid instruments:
- Define a five-bar consolidation using completed one-minute bars.
- Require its total range to remain below a volatility-adjusted threshold.
- Enter one tick above the consolidation high.
- Place the stop below the consolidation low.
- Exit at a fixed multiple of initial risk or after three minutes, whichever occurs first.
- Take no more than one entry per consolidation.
Assume the consolidation high is $50.00, the low is $49.94, and the entry trigger is $50.01. The structural risk is $0.07 per share from entry to stop.
The backtest should not automatically record a $50.01 fill when that price first appears. It should apply the chosen order model and costs. If the estimated fill is $50.02 and the exit incurs another $0.01 of slippage, realized risk is already different from the chart-defined risk.
Now suppose a one-minute bar trades from $49.93 to $50.12 after entry. Both the stop and target may be inside that range. Without lower-resolution sequencing, the outcome is unknown. The test should use its predefined adverse-first rule or classify the trade as ambiguous.
Finally, test nearby definitions rather than only the selected settings. If a five-bar consolidation appears favorable but four- and six-bar versions collapse, the result may reflect parameter luck instead of a stable market effect.
Common Scalping Backtest Failure Modes
Ignoring the bid-ask spread
Testing entries and exits against a single last-traded price can manufacture an edge that was never tradable. Model which side of the market the strategy would cross.
Treating touched limit orders as guaranteed fills
Other orders may have been ahead in the queue, and displayed liquidity may disappear. Use conservative assumptions and compare them with paper-trading observations.
Optimizing too many filters
Testing many indicators, time windows, stops, and targets creates numerous chances to find a strong result by accident. Keep a log of every variation tested, not just the winner.
Using average costs during stressed periods
Spreads and slippage often worsen when volatility rises. A crisis stress test should use harsher execution assumptions, not only unusual price data.
Confusing a market pattern with an executable edge
Price may move in the predicted direction after a signal while the available entry, fill rate, and exit liquidity make the trade impractical. Directional accuracy is not the same as net expectancy.
Scaling historical fills without capacity checks
A fill model that appears reasonable for a small order may fail at larger size. Research results should not be scaled linearly without considering available liquidity and market impact.
Browsing tradeable signals in the research library.
A Practical Kvants Research Workflow
In Kvants Studio, a trader can describe a scalp hypothesis in plain English and convert it into editable, auditable strategy logic. Review every generated condition to confirm that timing, order behavior, and risk rules match the intended setup.
Backtests run on NautilusTrader’s event-driven engine, which is useful when order sequencing matters. Traders can also run parameter sweeps, walk-forward validation, and crisis-stress tests. The broader Kvants research library covers related testing and risk concepts.
A sensible workflow is:
- Write the hypothesis without parameters optimized to past results.
- Generate and inspect the strategy logic.
- Configure the relevant market, session, data, costs, and order assumptions.
- Run a baseline test and inspect individual trades for timing errors.
- Stress slippage, spread, latency assumptions, and ambiguous fills.
- Reserve unseen periods for walk-forward or out-of-sample evaluation.
- Move to controlled paper trading to compare modeled and observed execution.
Kvants can organize and accelerate this research process, but it cannot make inadequate data represent queue position or guarantee that historical fills will recur.
Practicing strategy building against graded challenges.
Scalping Strategy Backtest Checklist
Before accepting a result, confirm that:
- All indicators use only information available at the decision time.
- Entries, exits, re-entries, and timeouts are unambiguous.
- The data resolution can represent the event sequence.
- Stops and targets cannot receive favorable same-bar treatment.
- Spread, fees, and slippage are included.
- Limit-order fills are not guaranteed by a simple touch.
- Results survive plausible increases in costs.
- Nearby parameter values show reasonably consistent behavior.
- Unseen periods and different regimes have been tested.
- Paper execution will be compared with modeled execution before risking capital.
Frequently Asked Questions
Can you backtest a scalping strategy with one-minute candles?
You can test strategies that make decisions only from completed one-minute bars, but important sequencing may remain unknown. If entry, stop, and target can occur in the same candle, use lower-resolution data or conservative ambiguity rules.
How much slippage should a scalping backtest use?
There is no universal value. Slippage depends on the instrument, venue, order type, size, volatility, and session. Start with observed or defensible estimates, then stress the result with progressively worse assumptions.
Are limit orders better than market orders for a scalp test?
Neither is universally better. Limit orders control price but introduce non-fill and queue risk. Market orders prioritize execution but cross the spread and may slip. Model the order type the live strategy would actually use.
How many trades are needed to validate a scalping strategy?
No fixed count guarantees reliability. More trades reduce sampling uncertainty, but thousands of biased or unrealistic trades remain misleading. Seek a broad sample across unseen periods, instruments, volatility conditions, and execution assumptions.
Should a profitable backtest go directly into live trading?
No. First verify the logic, test unseen data, stress costs, and use controlled paper trading. If live testing follows, begin within predefined risk limits and compare actual fills with the model.
Risk Note
This article is educational and is not investment advice. Scalping can involve rapid losses, high transaction costs, execution uncertainty, and significant operational risk. Backtested performance does not guarantee future results. Kvants is a research tool, not an investment adviser, and no test can fully reproduce future liquidity, slippage, latency, or market conditions.