Learn how to define a breakout retest strategy with objective level, entry, invalidation, and timeout rules—then test whether the pattern holds up after costs.
Quick Answer
A breakout retest strategy waits for price to move beyond a predefined support or resistance level, return to that area, and then show renewed movement in the breakout direction. To test it reliably, define the level before the breakout, specify what counts as a valid break and retest, and set exact entry, stop, target, and timeout rules. The main limitation is subjectivity: if levels or confirmations are selected after seeing the outcome, the backtest is contaminated by hindsight.
Key Takeaways
- Define support or resistance using information available before the breakout.
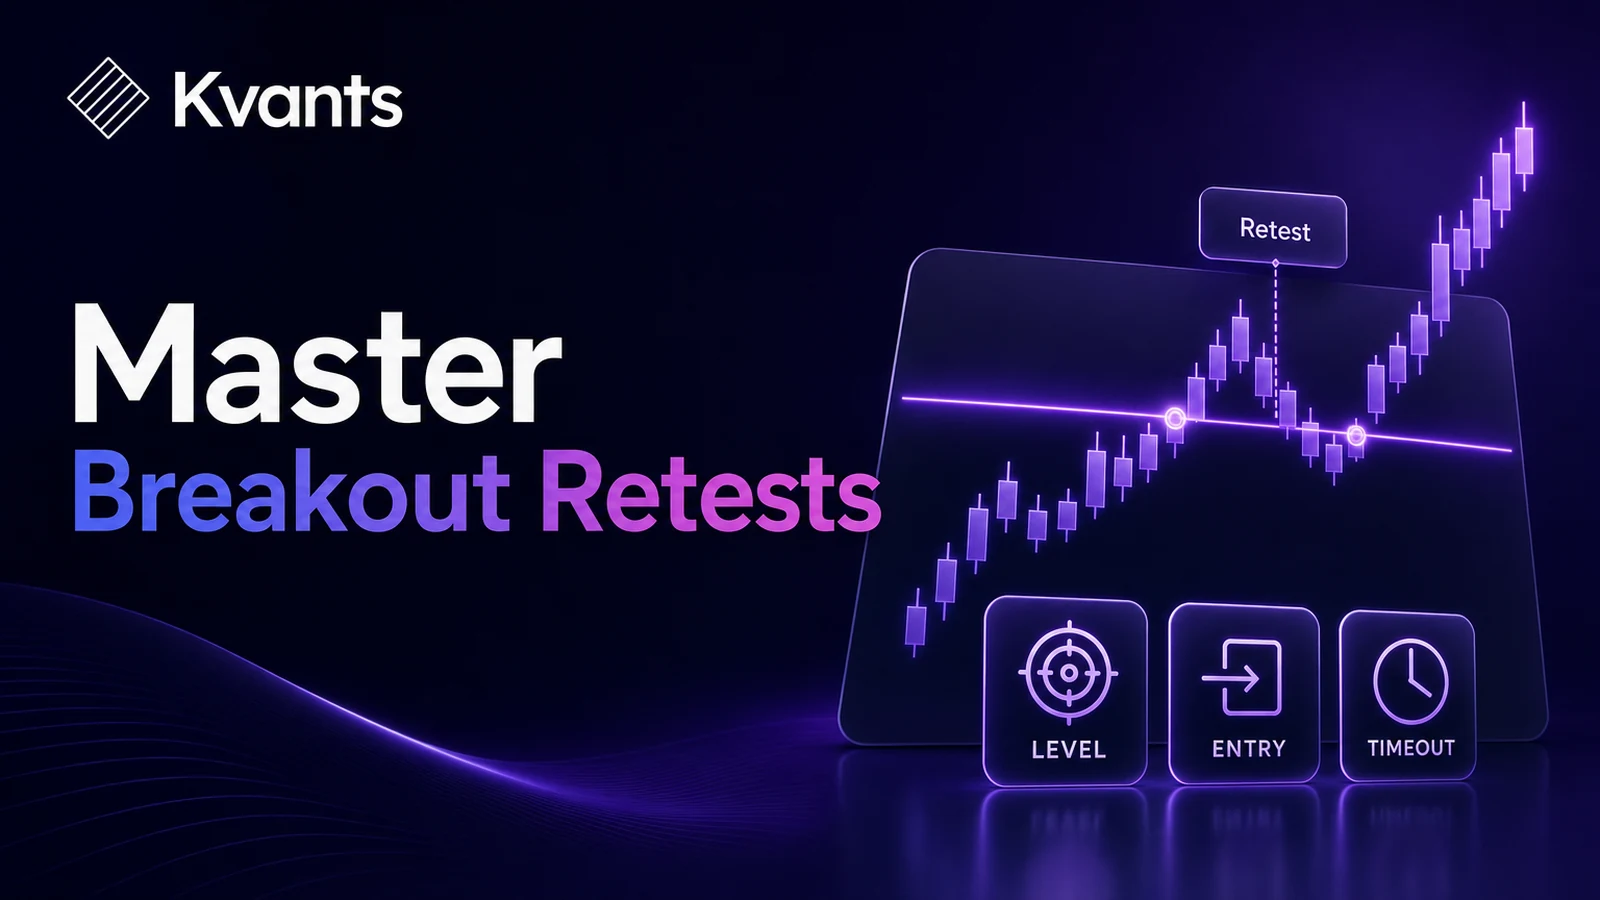
- Treat the setup as a sequence: level, breakout, retest, confirmation, entry, and exit.
- Use tolerances rather than requiring price to touch one exact number.
- Add timeouts so an old breakout cannot trigger an entry indefinitely.
- Test costs, intrabar order sequencing, and parameter sensitivity before drawing conclusions.
What a Breakout Retest Strategy Actually Tests
A breakout retest is not simply a candle crossing a line. It is a multi-stage hypothesis about market behavior:
- A visible level constrains price.
- Price moves decisively through that level.
- Price returns toward the former boundary.
- The boundary holds as support after an upside breakout or resistance after a downside breakout.
- Price resumes moving in the breakout direction.
For a long setup, resistance is expected to become support. For a short setup, support is expected to become resistance.
The idea sounds precise until each term must be coded. What makes a level “visible”? Must a candle close beyond it? How close must price come during the retest? What does “holds” mean? A valid strategy needs numerical answers.
The pattern should therefore be modeled as a state machine. The strategy advances only when each stage occurs in the required order. If an invalidation condition occurs, it resets instead of informally reinterpreting the chart.
Objective Breakout Retest Strategy Rules
The following framework is a research template, not a recommended strategy. Every parameter should be tested for the chosen market and timeframe.
1. Define the level without future information
One objective method is to use a confirmed rolling high or low:
- Resistance: highest high of the previous 20 completed bars.
- Support: lowest low of the previous 20 completed bars.
- Exclude the current bar from the calculation.
Other valid approaches include prior-session highs and lows, confirmed swing points, or consolidation boundaries. Avoid manually drawing only the levels that later produced clean reactions.
2. Require a valid breakout
For an upside breakout, require the bar to close above resistance by a minimum buffer. The buffer can be expressed as:
- A percentage of price.
- A fraction of average true range (ATR).
- A fixed tick or point distance.
An ATR-based rule adapts to volatility. For example, a close must exceed resistance by at least 0.1 ATR. That number is only a test parameter; it is not universally optimal.
The short rule is mirrored below support.
3. Define the retest zone
Exact touches are unnecessarily brittle. Define a zone around the broken level, such as resistance plus or minus 0.2 ATR as measured when the breakout occurs.
A long retest occurs when price enters that zone after the breakout. Decide whether a wick is enough or whether the close must also remain above the level. These are different strategies and should not be mixed within one sample.
4. Add confirmation and invalidation
A simple long confirmation could require a bar to enter the retest zone and close above the broken resistance. Entry then occurs at the next bar’s open or above the confirmation bar’s high.
Invalidate the setup if price closes below the retest zone before entry. A more permissive rule may allow a brief close below the original level, but that tolerance must be specified in advance.
5. Set a retest timeout
Require the retest to occur within a fixed number of bars, such as ten. If it arrives later, reset the setup.
Without a timeout, a strategy may label a pullback weeks after the breakout as part of the original pattern. That weakens comparability and can create overlapping signals.
6. Specify exits and risk
Possible stop rules include:
- Below the retest low for a long trade.
- Beyond the opposite edge of the retest zone.
- A fixed ATR distance from entry.
Possible exits include a fixed R-multiple, a trailing rule, a time exit, or an opposing signal. Start with one simple exit so the entry hypothesis can be evaluated without excessive moving parts.
A strategy laid out end to end in the Kvants editor.
Worked Example
Assume a hypothetical market has resistance at 100 based on the highest high of the previous 20 completed bars. ATR at the breakout is 2.
The rules require:
- A close at least 0.1 ATR above resistance.
- A retest within eight bars.
- A retest zone of plus or minus 0.2 ATR around the level.
- Entry above the high of a confirmation bar that closes back above resistance.
- A stop below the retest low.
- An exit at 2R or after 15 bars, whichever comes first.
The minimum breakout close is 100.20. The retest zone extends from 99.60 to 100.40.
Price closes at 100.50, activating the setup. Three bars later, it trades down to 99.90 and closes at 100.30. That bar qualifies as a retest confirmation. If its high is 100.60, a buy-stop entry can be placed above 100.60 for the next eligible bar.
Suppose the entry fills at 100.65 and the retest low is 99.85. Initial risk is 0.80 per unit, so a 2R target is 102.25. Position size would be determined from the permitted account risk divided by 0.80, with fees and expected slippage included separately.
This example does not establish that the setup has an edge. It only demonstrates rules that can be reproduced without redrawing the level after the result is known.
Step-by-Step Backtesting Workflow
1. Freeze the complete specification
Write down the level lookback, breakout buffer, retest zone, timeout, confirmation, entry type, stop, exit, and sizing rule. Version the specification before testing it.
2. Verify signal timing
Confirm that rolling levels exclude the current bar and that orders cannot fill before the confirming information exists. If entry depends on a bar’s close, the strategy cannot assume a fill earlier in that same bar.
3. Model execution conservatively
Include commissions, spread, and slippage assumptions appropriate to the instrument. Stop orders can fill beyond their trigger during fast movement or gaps.
Intrabar ambiguity also matters. If a bar touches both the stop and target, bar-level data may not reveal which occurred first. Use lower-resolution data, an event-driven model, or a conservative sequencing rule.
4. Separate development from validation
Develop the initial rules on one period, then evaluate them on unseen data. If parameters are revised after seeing validation results, that period has become part of development and a new unseen sample is needed.
5. Test parameter neighborhoods
Do not test only one fortunate combination. Sweep nearby values for the level lookback, breakout buffer, retest width, and timeout. A result that disappears after a tiny adjustment may be overfit.
6. Segment the results
Review performance by market, volatility regime, direction, session, and trend context. Examine trade count, expectancy after costs, drawdown, win rate, payoff ratio, and exposure together. A strong aggregate result can conceal dependence on one symbol or brief period.
Backtest results with metric tiles and gate coaching.
Common Failure Modes
Hindsight-defined levels
Selecting only visually impressive boundaries gives the strategy information it would not have had in real time. Use deterministic levels or timestamp levels recorded during forward observation.
Counting the breakout bar as the retest
If the same bar breaks the level and trades back through it, the order of events may be unknown. Either require the retest to begin on a later bar or use data that can resolve the sequence.
Unlimited setup life
A breakout that remains active indefinitely can produce unrelated entries. Apply both a retest timeout and an entry timeout.
Over-filtering
Adding volume, trend, momentum, candle-shape, and session filters can improve historical results while reducing the sample and increasing overfitting risk. Add one filter at a time and require a clear rationale.
Ignoring unfilled orders
A stop-entry above a confirmation bar may never fill. Do not record the trade at a convenient closing price unless that is the actual entry rule.
Testing the Rules in Kvants
A plain-English specification can be entered into Kvants Studio and translated into editable, auditable strategy logic. Traders can inspect the generated rules rather than treating the output as a black box.
Kvants supports stocks and crypto research on NautilusTrader’s event-driven backtesting engine. Relevant validation tools include parameter sweeps, walk-forward testing, and crisis-stress testing. Compatible strategies can also be exported to Pine Script v6 for chart inspection.
Before running a test, document each assumption—especially order timing, retest-zone behavior, costs, and same-bar conflicts. The Kvants documentation provides guidance on prompting, strategy logic, and exports. Kvants is a research environment; it does not determine whether a strategy is suitable for a particular trader.
Kvants audits that the engine runs the strategy you configured.
Frequently Asked Questions
Does a retest have to touch the exact breakout level?
No. Markets rarely respect a level to an exact tick. A predefined zone based on ATR, percentage distance, or tick size is usually easier to test consistently. The zone must be fixed before outcomes are reviewed.
Should volume confirm the breakout?
Volume can be tested as a filter, but it should not be assumed to improve every breakout strategy. Data quality and interpretation also vary across stocks and crypto venues. Compare otherwise identical rules with and without the filter on unseen data.
Is it better to enter on the retest or after confirmation?
Entering during the retest may provide a closer stop but risks acting before the level holds. Waiting for confirmation reduces that ambiguity but may produce a later entry or no fill. Neither method is universally superior; define both as separate variants and compare them after realistic costs.
How long should a trader wait for the retest?
There is no universal number of bars. The timeout should reflect the strategy timeframe and intended holding period. Test a reasonable range rather than choosing the single historical value with the best result.
How can false breakouts be reduced?
Possible filters include a close beyond the level, a volatility-adjusted breakout buffer, a retest hold, or alignment with a broader trend. Filters can reduce trade frequency and may overfit, so their value must be tested out of sample.
Risk Note
This article is educational and is not investment advice. Breakout trades can fail, gap through stops, or incur greater costs than modeled. Backtested performance does not guarantee future results. Validate data, assumptions, execution rules, and risk limits before using any strategy in paper or live trading.