Build a moving average crossover strategy with precise signals, realistic execution, risk rules, filters, and a backtesting workflow designed to expose false confidence.
Quick Answer
A moving average crossover strategy buys or sells when a faster moving average crosses a slower one. To test it properly, define the average type, periods, signal timing, entry price, exit rules, position sizing, and costs before running a backtest. The main limitation is whipsaw: crossovers lag price and can repeatedly reverse in sideways markets. A useful test therefore asks not only whether a parameter pair made money historically, but whether the underlying behavior remains stable across instruments, periods, costs, and unseen data.
Key Takeaways
- Define a crossover with exact bar-by-bar conditions rather than judging it visually.
- Generate a signal only from data that was available at that moment, then model a realistic later fill.
- Test SMA and EMA variants separately because they respond differently to recent prices.
- Include commissions, spread, slippage, and an adequate moving-average warm-up period.
- Treat trend, volatility, and time filters as hypotheses to validate—not automatic improvements.
- Prefer stable parameter regions over the single highest-performing combination.
How to Define a Moving Average Crossover Strategy
A moving average summarizes a selected price series over a rolling window. A fast average uses fewer bars and reacts more quickly; a slow average uses more bars and changes more gradually.
The two common choices are:
- Simple moving average (SMA): gives equal weight to every observation in its window.
- Exponential moving average (EMA): gives more weight to recent observations and therefore reacts faster to new prices.
Neither is universally superior. An EMA may enter a developing trend sooner, but that sensitivity can also produce more reversals. An SMA is smoother, but its signals may arrive later.
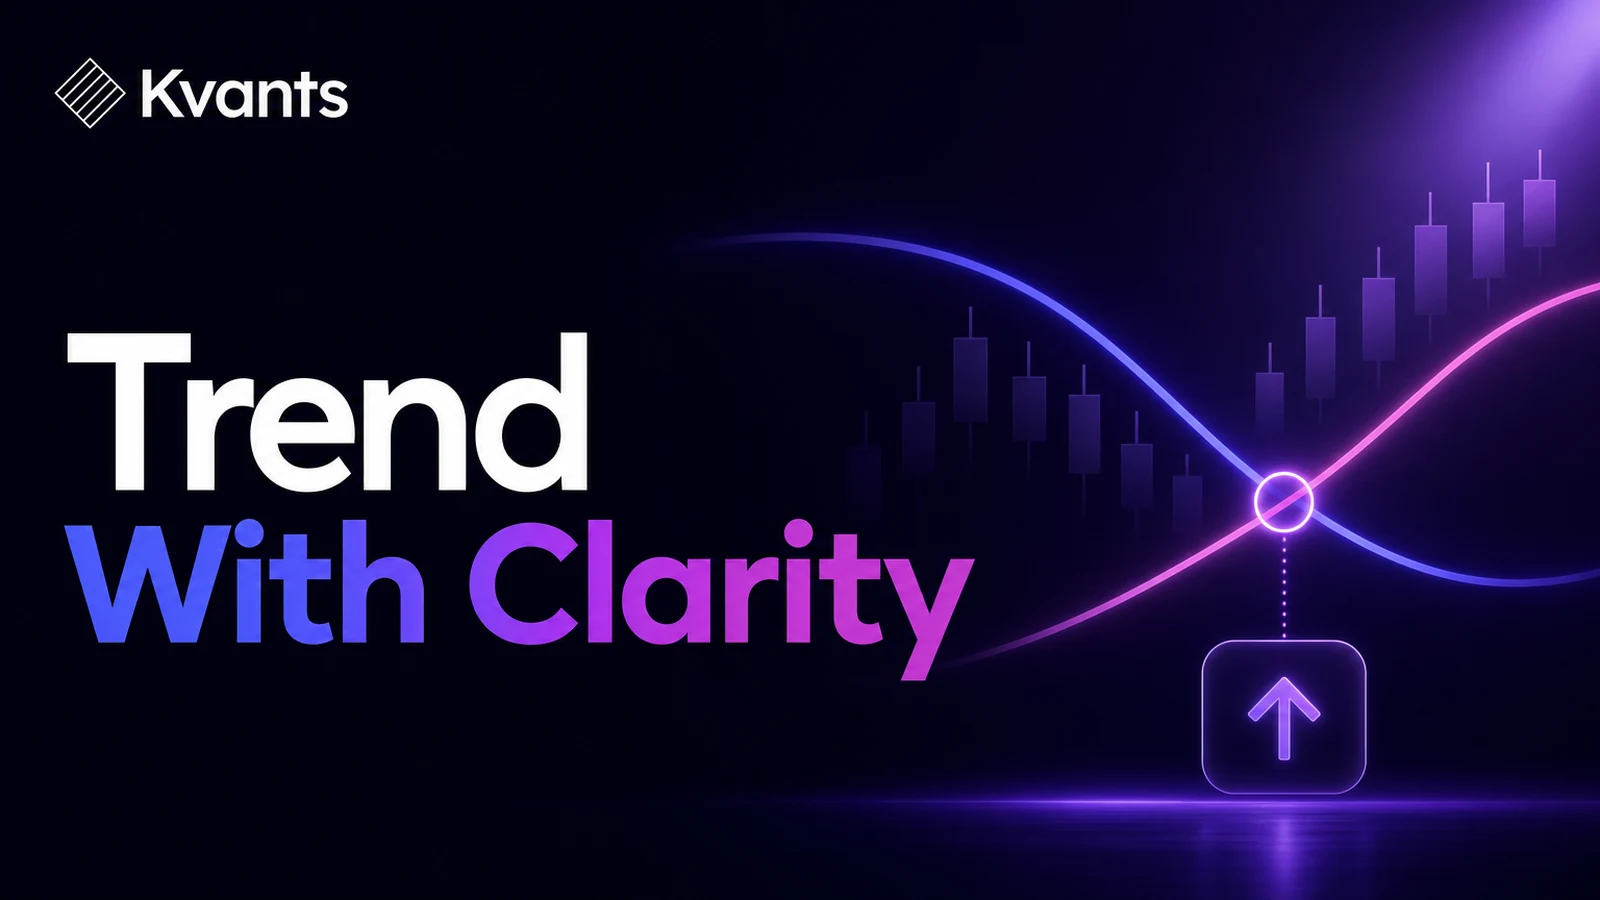
For a bullish crossover on bar t, use an explicit condition:
FastMA[t] > SlowMA[t]
FastMA[t-1] <= SlowMA[t-1]
The first line confirms that the fast average is currently above the slow average. The second proves that the crossover occurred on this bar rather than several bars earlier.
A bearish crossover reverses the inequalities:
FastMA[t] < SlowMA[t]
FastMA[t-1] >= SlowMA[t-1]
This distinction matters. A rule such as “buy when the fast average is above the slow average” describes a persistent state. Without position-state controls, it could trigger another entry on every bar. A crossover describes a one-time event.
You must also specify the input price. Close is common, but open, median price, or another series creates a different strategy. Avoid changing the input after seeing disappointing results unless you treat the change as a new hypothesis.
A strategy laid out end to end in the Kvants editor.
Separate the Signal From the Fill
A strategy using closing prices cannot know the final moving-average values until the bar closes. It therefore cannot assume an entry at that same closing price unless the testing environment explicitly models an executable closing auction or another justified order process.
A cleaner default is:
- Calculate both averages when bar
tcloses. - Confirm the crossover using bars
tandt-1. - Submit the order after the signal is known.
- Model the fill at the next bar’s open, including applicable costs and slippage.
This creates a clear separation between signal time and execution time. It also exposes overnight or between-bar gaps that a same-close backtest might hide.
If the strategy uses intraday bars, the same principle applies. A crossover confirmed at the end of a five-minute candle should not receive a fill from earlier within that candle.
The backtest also needs enough historical data to initialize both averages. A 200-bar slow average is not valid after only 50 bars. Use a warm-up period at least as long as the slowest indicator requirement, and do not count trades generated from incomplete values.
Build the Strategy in Six Steps
1. Choose the market and timeframe
Start with the actual instrument universe and timeframe you intend to research. A crossover on daily equity data faces different gaps, costs, and trading hours than one on continuously traded crypto data.
Define whether the strategy trades one instrument, rotates among several, or holds multiple simultaneous positions. Portfolio-level exposure can materially change risk even when each individual signal is unchanged.
2. Define the crossover pair
Select a fast and slow period, with the fast period strictly shorter than the slow period. Begin with a defensible range rather than searching hundreds of arbitrary combinations.
The periods represent a responsiveness trade-off. Shorter settings react quickly but may trade more often. Longer settings smooth more noise but accept greater lag.
3. Write entry and exit rules
Decide whether the strategy is long-only or trades both directions. Then specify whether an opposite crossover closes the current position, reverses it, or merely blocks new entries.
Also define what happens when an order cannot fill as expected. The backtest should have rules for gaps, missing bars, duplicate signals, and already-open positions.
4. Add position sizing and risk limits
A signal does not determine how much to trade. Position size can be fixed, volatility-adjusted, or based on predefined account risk. If you use a protective stop, define whether it is based on price structure, percentage distance, or volatility.
An opposite-crossover exit alone can leave a position exposed while the averages slowly converge. That may be intentional for a trend-following system, but it should be measured rather than overlooked.
5. Model trading friction
Include commissions, bid-ask spread, slippage, and any funding or borrowing costs relevant to the market. Faster crossover settings usually generate more turnover, making cost assumptions especially important.
Run more than one cost scenario. A strategy that works only when execution is nearly free may be too fragile for practical use.
6. Define evaluation criteria in advance
Assess more than total return. Useful measures include drawdown, expectancy, profit factor, trade count, average holding period, turnover, exposure, and the distribution of wins and losses.
Also inspect performance by market regime and calendar segment. A result dominated by one sustained trend may not describe how the strategy behaves most of the time.
A backtest's equity curve and trade-by-trade log.
Worked Example: A Testable EMA Crossover
Consider a hypothetical long-only strategy on daily bars:
- Fast average: 20-period EMA of closing price
- Slow average: 50-period EMA of closing price
- Entry signal: 20 EMA crosses above the 50 EMA at the daily close
- Entry execution: next session’s open
- Exit signal: 20 EMA crosses below the 50 EMA at the daily close
- Exit execution: next session’s open
- Position state: one open position per instrument; repeated bullish states do not add exposure
- Sizing: fixed percentage of available strategy capital
- Costs: commission, spread, and slippage applied to every entry and exit
- Warm-up: no signals until both averages are fully initialized
Suppose the 20 EMA was below the 50 EMA on Monday and closes above it on Tuesday. Tuesday is the signal bar. The hypothetical entry occurs at Wednesday’s open—not Tuesday’s close.
If Wednesday opens sharply higher, the backtest uses that higher available price under the stated model. It must not retain Tuesday’s closing price simply because that produces a more attractive trade.
This example is testable, but it is not automatically complete. Before deployment, research how gaps are handled, whether a protective stop is required, how simultaneous positions affect total exposure, and whether the result remains viable outside the development sample.
Deploying a strategy to paper or live with a pre-flight gate.
Filters: Test the Problem They Are Meant to Solve
Filters can reduce unwanted trades, but every additional condition increases complexity and the opportunity to overfit.
A few defensible hypotheses are:
- Slow-average slope: take bullish signals only when the slow average is rising.
- Price-location filter: require price to close above the slow average for long entries.
- Volatility filter: avoid periods where volatility is outside a predefined range.
- Higher-timeframe filter: permit lower-timeframe signals only when the higher timeframe has the same directional state.
- Minimum separation: require a specified distance between the averages after they cross.
Test one change at a time. State why it should help, which failure mode it targets, and which metric should improve. For example, a slope filter is intended to avoid flat environments. It should be judged by whether it reduces whipsaw without removing too many valuable early-trend entries.
A filter that improves the development sample but fails on unseen data has not demonstrated durable value.
Common Failure Modes
Whipsaw in sideways markets
When price oscillates without a sustained trend, fast and slow averages can cross repeatedly. Losses may be individually small but accumulate through reversals and trading costs.
Hidden look-ahead bias
Using a bar’s final close to calculate a crossover and entering earlier on that same bar uses information that was not yet available. This can make entries appear materially better than they were.
Optimizing one perfect pair
Testing many combinations and selecting only the highest-performing pair can fit historical noise. Look for a region of neighboring settings with reasonably consistent behavior instead of one isolated peak.
Ignoring short-side differences
A bearish crossover is mathematically symmetrical, but market behavior and implementation may not be. Short trades can involve borrowing constraints, different gap risk, and asymmetric long-term price behavior. Validate the short side separately.
Underestimating costs
Small cost assumptions can have a large cumulative effect when the strategy reverses often. Cost sensitivity should be part of validation, not an adjustment made after deployment.
Relying on one market regime
Trend-following logic can look compelling during persistent advances or declines. Test quiet, volatile, trending, and range-bound periods to understand when the strategy is likely to struggle.
Validate Parameters Without Chasing the Best Backtest
Run parameter sweeps across sensible fast and slow ranges, while enforcing fast < slow. Visualize whether acceptable results form broad, stable areas or isolated spikes.
Then divide research into development and validation stages. Use walk-forward analysis to choose or evaluate parameters on earlier data and measure them on later, unseen periods. Add crisis or stress windows to inspect behavior under gaps, volatility shocks, and changing liquidity.
Parameter stability does not guarantee future performance. It does, however, provide stronger evidence than choosing the best result from one full-history test.
With Kvants Studio, you can describe crossover rules in plain English, inspect and edit the resulting strategy logic, and run event-driven backtests on NautilusTrader’s engine. Parameter sweeps, walk-forward analysis, and crisis-stress validation can help examine sensitivity before moving to controlled paper or live workflows. Validated logic can also be exported to Pine Script v6. The Kvants documentation provides workflow guidance, while the Kvants blog covers related strategy research concepts.
Frequently Asked Questions
What is the best moving average crossover?
There is no universally best pair. The appropriate periods depend on the market, timeframe, costs, desired holding period, and acceptable lag. Search for robust parameter regions and validate them on unseen data rather than selecting a pair from reputation alone.
Is an EMA crossover better than an SMA crossover?
Not inherently. EMAs respond faster to recent price changes, which may produce earlier entries and more false reversals. SMAs react more slowly and may reduce some noise while entering later. Test each as a separate strategy under identical assumptions.
Why do moving average crossovers produce false signals?
Moving averages summarize past prices and cannot know whether a new move will continue. In range-bound conditions, small directional changes can cause repeated crossings without a sustained trend. Filters may reduce this behavior, but they can also delay valid entries.
Should I enter as soon as the averages cross intrabar?
Only if the strategy calculates and executes on intrabar data. A crossover that appears during a candle may disappear before it closes. If the rule requires close confirmation, wait until the bar is complete and model execution afterward.
Do crossover strategies need a stop loss?
That is a strategy-design decision. An opposite crossover can serve as an exit, but it may react slowly. Test protective stops separately and measure their effects on drawdown, premature exits, turnover, and overall trade distribution.
Risk Note
This article is educational and is not investment advice. Moving average signals can lag, whipsaw, and produce losses, especially after costs or during changing market conditions. Kvants is a research tool, not an investment adviser. Backtested performance does not guarantee future results. Use realistic assumptions, validate on unseen data, and apply risk limits appropriate to your circumstances.