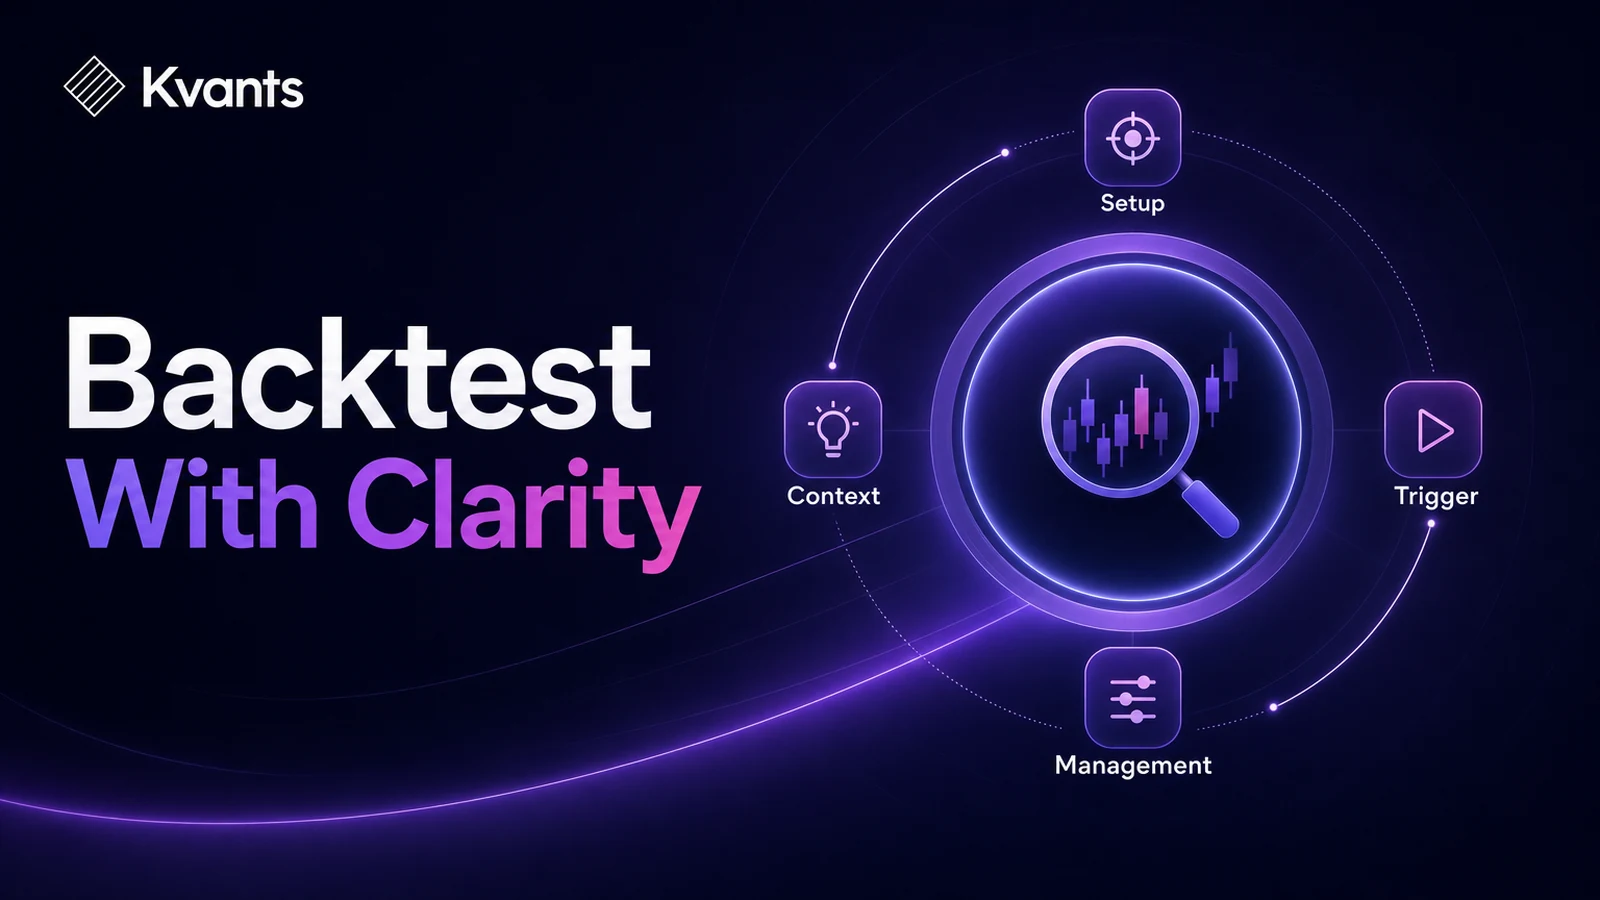
Learn how to backtest a discretionary trading strategy by separating context, setup, trigger, and management rules while preserving judgment as a measurable layer.
Quick Answer
To backtest a discretionary trading strategy, separate the setup into observable context, entry, invalidation, and exit rules. Test those rules as a baseline, then record where your judgment would accept, reject, or modify each signal. This preserves discretion without letting hindsight redefine the setup after every outcome. The main limitation is that concepts such as “clean structure” or “strong momentum” cannot be tested reliably until you define how they are recognized.
Key Takeaways
- Treat discretion as a decision layer, not as an excuse for undefined rules.
- Divide the strategy into context, setup, trigger, risk, and management components.
- Use measurable proxies for visual concepts, then test several reasonable definitions.
- Compare the baseline signal set with the trades your judgment accepts or rejects.
- Validate the strategy across unseen periods and adverse assumptions before using it live.
Why Discretionary Strategies Are Difficult to Test
A discretionary trader does not necessarily trade without rules. The rules may be partly explicit and partly based on pattern recognition developed through observation.
For example, “buy a pullback in a strong uptrend” contains at least three unresolved decisions:
- What qualifies as an uptrend?
- How deep can the pullback be?
- What confirms that the pullback has ended?
On a finished chart, those decisions can appear obvious. During a live bar, they are not. Knowledge of the subsequent move can influence which trend looks strong, which level appears important, and which rejection candle deserves attention.
A useful backtest must therefore separate two things:
- What was observable at the decision time.
- What the trader decided using that information.
The goal is not to eliminate judgment. It is to make the judgment reviewable.
Build a Testable Strategy Skeleton
Before reviewing charts, write the strategy as five separate layers. This prevents one vague visual impression from controlling the entire test.
1. Market context
Context determines when the strategy is allowed to operate. It might include trend direction, volatility, session, market regime, or proximity to a higher-timeframe level.
Replace broad descriptions with observable definitions. Instead of “strong uptrend,” possible definitions include:
- Price is above a chosen moving average.
- The moving average has risen over a defined lookback.
- A recent swing high has been exceeded.
- Higher-timeframe return is positive over a specified period.
These are hypotheses, not universal definitions. Testing should reveal whether the result depends on one narrow interpretation.
2. Setup
The setup describes the condition you are waiting to trade. Examples include a pullback, breakout, liquidity sweep, volatility contraction, or return to a price zone.
Define its boundaries. A pullback could require price to retrace a percentage of the prior impulse without closing below a structural low. A zone could be represented by a previous high, rolling range boundary, or price interval derived from recent volatility.
3. Entry trigger
The trigger specifies when a valid setup becomes a trade. It must use information available at that moment.
Possible triggers include:
- A close above the previous bar’s high.
- A break of a defined lower-timeframe swing.
- A limit order at a predetermined price.
- Entry on the next bar after confirmation.
State whether the decision occurs intrabar or after the close. That distinction can materially change fills and sequencing.
4. Invalidation and position risk
Define the price condition proving the trade idea wrong. Then distinguish that technical invalidation from the amount of account equity placed at risk.
A structural stop, volatility-based stop, and fixed-distance stop can produce different trade distributions even when the entry is identical. Include commissions, spread, and slippage assumptions where relevant.
5. Exit and management
“Manage based on price action” is not testable by itself. Break management into explicit decisions:
- Initial profit target
- Trailing condition
- Break-even rule
- Partial exit
- Maximum holding period
- Session close exit
If management remains discretionary, preserve the original position path and record each intervention separately. Otherwise, favorable outcomes can make unnecessary interventions look skillful.
The Kvants trading terminal and market co-pilot.
How to Backtest a Discretionary Trading Strategy Step by Step
Step 1: Write the setup before seeing the sample
Create a short specification using only information that would be available before entry. Include the instrument universe, timeframe, trading window, context, trigger, stop, exit, and cost assumptions.
Do not begin with hundreds of exceptions. Start with the simplest plausible version of the idea.
Step 2: Mark genuinely subjective variables
Label every term that still requires visual judgment. Common examples are:
- Clean trend
- Important level
- Strong rejection
- Excessive extension
- Poor market structure
Do not hide these terms inside supposedly objective rules. They are the variables you need to study.
Step 3: Create measurable proxies
For each subjective variable, propose one or more observable substitutes. “Strong rejection,” for example, might be represented by wick length relative to total candle range, a close within the upper portion of the candle, or a close above a prior bar.
The proxy does not have to capture human perception perfectly. It needs to be consistent enough to reveal whether the underlying idea has evidence behind it.
Step 4: Test the baseline rules
Run the same definitions across all eligible historical signals. Record more than net return. Useful outputs include:
- Number of opportunities
- Win and loss distribution
- Expectancy after estimated costs
- Maximum drawdown
- Consecutive losses
- Holding time
- Results by market, session, volatility, and regime
A strategy can have an attractive aggregate result while depending on one brief period or a small group of trades.
Step 5: Add a blinded discretion review
Review signals without revealing what happened after the decision point. Classify each one as accepted, rejected, or modified, and write a short reason.
Then compare the discretionary subset with the complete baseline. Ask whether judgment improves the distribution consistently, reduces only certain failure modes, or merely removes losing trades with hindsight.
Step 6: Test alternative definitions
Vary reasonable thresholds rather than optimizing a single perfect combination. If a small change in trend length, pullback depth, or entry timing destroys the result, the strategy may be too fragile.
Look for a stable neighborhood of workable definitions. Stability is generally more informative than the highest historical result.
Step 7: Validate on unseen data
Keep part of the history out of strategy development. After fixing the rules, evaluate them on the reserved period. For strategies that may change with market conditions, use walk-forward analysis to repeat development and evaluation through time.
Finally, stress the assumptions with worse fills, higher costs, delayed entries, missed trades, and modest parameter changes.
A backtest's equity curve and trade-by-trade log.
Worked Example: Testing a Trend-Pullback Setup
Suppose a trader’s original idea is: “Buy a clean pullback into support during a strong intraday uptrend, then enter when buyers regain control.”
A testable baseline might become:
- Market: A predefined list of liquid instruments
- Context: Price is above a rising higher-timeframe moving average
- Impulse: Price has closed above a recent rolling high
- Pullback: Price retraces into a volatility-adjusted band around the breakout level without closing below the impulse origin
- Trigger: A bar closes above the previous bar’s high
- Entry: Next available price after the trigger
- Stop: Below the pullback low with a predefined buffer
- Exit: A fixed multiple of initial risk, a structural trailing rule, or a session deadline
The trader still believes some pullbacks are “messy.” That judgment becomes a separate review tag rather than an undocumented reason to delete trades.
The comparison should include three groups:
- Every baseline signal
- Signals accepted by the trader before seeing their outcomes
- Signals rejected by the trader before seeing their outcomes
If accepted trades hold up on unseen data while rejected trades remain weaker, the discretionary filter may add useful information. The next task is to identify what the trader sees and determine whether it can be documented. If the difference disappears out of sample, the filter may reflect hindsight or noise.
Common Failure Modes
Rewriting rules around losing trades
A loss does not prove the setup was invalid. If the trade followed the original specification, it belongs in the test. Change the rule only as a new hypothesis and retest the complete sample.
Using future information
Swing points, higher-timeframe bars, indicators, and zones must be constructed only from data available at the decision time. A level that becomes obvious three bars later was not necessarily known at entry.
Testing only memorable charts
Textbook winners and dramatic failures are easy to remember. A valid test needs every eligible occurrence, including marginal, repetitive, and uneventful signals.
Optimizing the proxy instead of the idea
Trying many filters can produce a historically impressive rule by chance. Keep the number of choices controlled, preserve unseen data, and prefer broad stability over one peak result.
Ignoring execution ambiguity
If the target and stop are both touched within the same bar, bar-level data may not reveal which occurred first. Use conservative assumptions or finer data, and document the choice.
Turning the Specification Into Auditable Research
Once the setup has explicit layers, it can be implemented in Kvants Studio from a plain-English description and inspected as editable strategy logic. This is useful for checking whether the implemented conditions match the trader’s actual intent.
Kvants supports stocks and crypto research on NautilusTrader’s event-driven backtesting engine. Parameter sweeps can compare reasonable proxy thresholds, while walk-forward and crisis-stress validation can test whether the result survives different periods and assumptions. Strategies can also be exported to Pine Script v6 or moved into controlled paper and live workflows.
The tool does not resolve undefined judgment on its own. The trader must still specify what information matters, inspect the resulting logic, and challenge favorable results. The Kvants documentation provides further guidance on prompting, strategy logic, and exports.
Kvants audits that the engine runs the strategy you configured.
Frequently Asked Questions
Can a discretionary trading strategy be backtested accurately?
It can be evaluated usefully, but not every human judgment can be reconstructed perfectly. Accuracy improves when observable rules form the baseline and discretionary decisions are recorded prospectively rather than inferred after outcomes are known.
Does turning discretion into rules remove the strategy’s edge?
Not necessarily. Rules establish a reference point. Judgment can remain as a filter, but its contribution should be measured against that baseline. If discretion adds value, accepted and rejected trades should show a repeatable difference on unseen data.
Is manual backtesting enough for a discretionary strategy?
Manual review is useful for visual context and decision training, but it is vulnerable to selection and hindsight bias. A stronger process combines systematic signal generation with blinded chart review and detailed decision records.
How should I test concepts that cannot be quantified easily?
Define several reasonable proxies and compare them. Also retain a human classification with a written reason. If the human filter appears useful, study the accepted and rejected examples to identify the observable features driving the decision.
When is a discretionary strategy ready for paper trading?
Move forward only after the rules are fixed, costs and execution constraints are represented, unseen-data results are reviewed, and the strategy survives reasonable stress tests. Paper trading should then test whether signals can be recognized and executed without hindsight.
Risk Note
This article is educational and is not investment advice. Trading involves risk, and discretionary decisions can introduce errors that historical tests do not capture. Backtested performance does not guarantee future results. Kvants is a research tool, not an investment adviser, and does not guarantee performance.