Learn how intrabar backtesting handles same-candle entries, stops, and targets—and how to test conservative execution assumptions when OHLC data cannot reveal price order.
Quick Answer
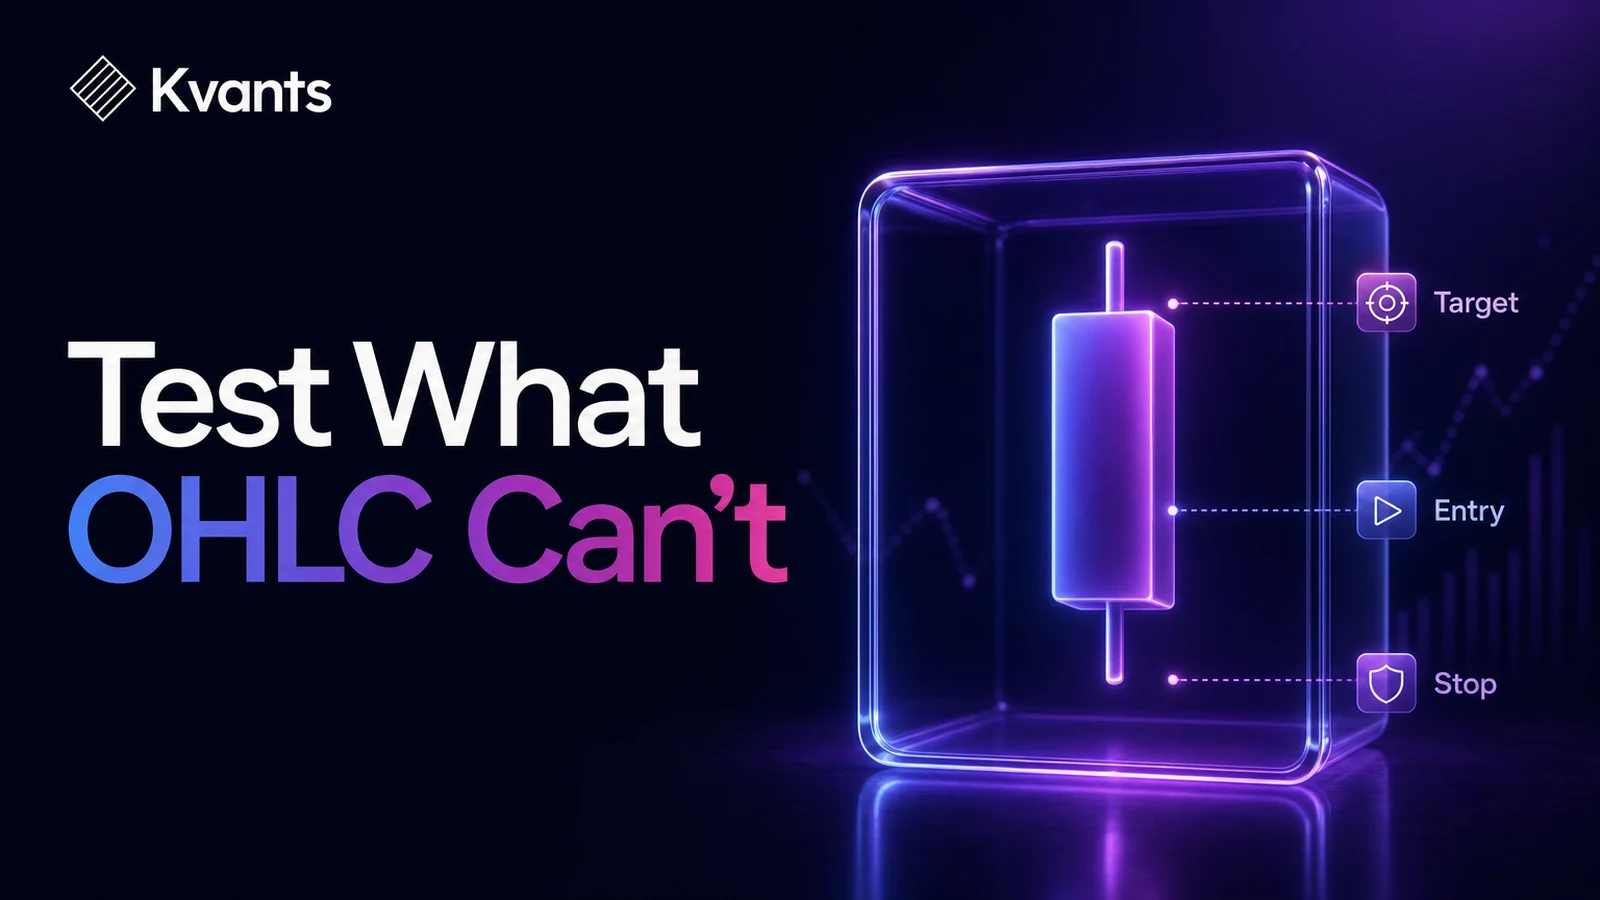
Intrabar backtesting evaluates what may have happened inside a candle when entries, stops, targets, or other orders can trigger before that candle closes. Standard OHLC data shows the open, high, low, and close, but not the sequence between them. If both a stop and target fall within one candle’s range, the outcome is unknowable without finer data. Use lower-resolution data where available, define explicit order-processing rules, and stress-test ambiguous trades under conservative assumptions.
Key Takeaways
- A candle’s high and low do not reveal which price was reached first.
- Same-bar stop and target hits must not automatically be counted as wins.
- Lower-timeframe or tick data can reduce ambiguity, but it does not eliminate every execution uncertainty.
- Order activation, price gaps, slippage, and partial fills need separate rules.
- A credible test should disclose how ambiguous trades were resolved.
- If small execution changes destroy the strategy’s results, the edge may be too fragile to trade.
Why OHLC Candles Create an Execution Problem
A historical candle normally contains four values: open, high, low, and close. Those values summarize the interval but discard the path price took through it.
Suppose a five-minute candle has:
- Open: 100.00
- High: 102.00
- Low: 98.50
- Close: 101.20
A long trade entered at 100.50 has a target at 101.50 and a stop at 99.50. The candle includes both prices. However, its OHLC values cannot tell you whether price reached 101.50 before falling to 99.50, or hit the stop before rallying.
Those paths produce opposite results. Any backtester using only that candle must therefore apply an assumption.
The problem becomes more serious when a strategy:
- Trades on short timeframes
- Uses tight stops or targets
- Places bracket orders immediately after entry
- Enters with stop or limit orders
- Scales into or out of positions
- Moves stops during the bar
- Trades volatile or thin markets
A backtest can still produce a precise equity curve despite unresolved sequencing. Precision in the report does not prove precision in the underlying simulation.
A backtest's equity curve and trade-by-trade log.
The Four Questions Intrabar Backtesting Must Answer
1. When does the order become active?
An order cannot fill before the event that creates it.
If a strategy enters after a candle closes, its protective stop and target should become eligible on the following event—not earlier within the completed signal candle. Allowing those orders to interact with prices that occurred before the signal was known introduces look-ahead bias.
For every order, define:
- The event that creates it
- The earliest time it may fill
- Whether it remains active after the current session
- What cancels or replaces it
2. What price path is observable?
Daily data provides less sequencing information than hourly data. One-minute bars provide more detail than five-minute bars, while tick or quote data may reveal individual updates.
Finer data is not automatically perfect. Trade prints may not show the bid and ask available for your order. Quotes may omit queue position. Aggregated feeds can still hide events. The correct question is not whether the data is “accurate,” but whether its resolution supports the decisions being simulated.
3. Which eligible order receives priority?
When multiple orders can execute, the test needs deterministic priority rules. These may include:
- Processing known market events chronologically
- Activating child orders only after the parent entry fills
- Cancelling the opposite side of a one-cancels-other bracket after one exit fills
- Preventing more units from exiting than the open position contains
- Applying a declared adverse rule when chronology is unavailable
Order priority should come from strategy and execution logic, not from whichever outcome makes the report look better.
4. How is the fill price calculated?
Touching a level does not guarantee that exact fill price.
A stop order can fill beyond its trigger during a gap. A limit order may trade at its price without filling your order, particularly if available liquidity is limited. Market orders cross the spread and can experience slippage.
A practical model should distinguish among trigger price, submitted order price, and simulated fill price.
Backtest results with metric tiles and gate coaching.
A Step-by-Step Intrabar Backtesting Workflow
Step 1: List every price-dependent event
Document entries, stops, targets, trailing-stop updates, scale orders, break-even moves, and time exits. Mark which events can occur during the same bar.
This exposes ambiguity before you run the test.
Step 2: Select the decision timeframe
The decision timeframe is the interval used to calculate signals. Keep it separate from the execution resolution.
For example, a strategy may generate signals from 15-minute candles but use one-minute data to simulate fills. Do not silently calculate the 15-minute indicator from information that was unavailable at the decision time.
Step 3: Use the finest justified execution data
Choose data fine enough to resolve the expected order sequence without adding unsupported detail. If one-minute data reveals that the target occurred at 10:07 and the stop level was not reached until 10:09, the five-minute ambiguity is resolved.
If both levels occur within the same one-minute candle, uncertainty remains. Do not invent a path between its high and low.
Step 4: Define a same-bar policy
Use one of these policies when available data cannot determine chronology:
- Adverse: Assume the less favorable eligible order fills first.
- Favorable: Assume the more favorable order fills first, but label this as an optimistic bound rather than the main result.
- Exclude: Mark the trade unresolved and remove it from the primary performance calculation.
- Range: Report both adverse and favorable outcomes to show the uncertainty interval.
The adverse policy is often suitable for a conservative baseline. Reporting a range provides more information when ambiguous trades are common.
Step 5: Add realistic execution costs
Include commissions, spread assumptions, and slippage appropriate to the market and order type. Test worse assumptions rather than relying on one estimate.
Costs and intrabar sequencing are related but separate. Resolving which order triggered first does not establish the price at which it would have filled.
Step 6: Count ambiguous trades
Record the number and percentage of trades affected by same-bar uncertainty. Also measure how much reported profit, loss, expectancy, and drawdown depend on the resolution policy.
A strategy with two ambiguous trades in 1,000 observations is different from one where a third of all trades change outcome under adverse ordering.
Step 7: Run sensitivity tests
Repeat the test using:
- Adverse and favorable same-bar policies
- Higher slippage
- Wider spread assumptions
- Delayed entries
- Different execution resolutions
- Small changes to stop and target distances
You are looking for stability, not the single configuration with the highest return.
A strategy laid out end to end in the Kvants editor.
Worked Example: Stop and Target Inside One Bar
Assume a strategy buys at 50.00, sets a stop at 49.60, and places a target at 50.80. The next 15-minute candle has a high of 51.00 and a low of 49.40.
The 15-minute data supports at least two valid paths:
- Price rises to 51.00, fills the target, then falls to 49.40.
- Price falls to 49.40, triggers the stop, then rises to 51.00.
At this resolution, the result is unresolved.
Now inspect one-minute data. Suppose the target level first appears in the 10:03 candle, while the stop level first appears in the 10:11 candle. Provided the entry and target were already active, the lower-timeframe sequence supports a target-first result.
But imagine both levels appear inside the 10:03 one-minute candle. The finer data has reduced uncertainty without eliminating it. The backtest must still apply its declared same-bar policy.
For reporting, compare three cases:
- Adverse case: record the stop
- Favorable case: record the target
- Exclusion case: mark the trade unresolved
If the overall strategy remains acceptable in the adverse case, sequencing risk is less concerning. If performance exists only in the favorable case, the strategy requires better data, wider order spacing, or rejection.
Common Failure Modes
Assuming a fixed OHLC path
Some simple tests assume every bullish candle moves open-low-high-close and every bearish candle moves open-high-low-close. Real markets do not follow a universal path based on candle color. Such a rule is a synthetic convention, not observed chronology.
Filling orders before they exist
A close-confirmed entry cannot receive an intrabar fill earlier in the same candle. This is a common hidden form of look-ahead bias.
Treating a touched limit as guaranteed
A candle reaching a limit price establishes price availability somewhere in the interval. It does not prove your full order would have filled at that price.
Ignoring gaps through stops
Stops are triggers, not guaranteed fill prices. Filling every stop exactly at its level can materially understate losses in fast or discontinuous markets.
Hiding ambiguity inside aggregate metrics
A headline win rate or profit factor is incomplete if many outcomes depend on favorable same-bar assumptions. Report ambiguity as a data-quality and model-risk issue.
Implementing Auditable Execution Rules
Write execution assumptions as strategy rules rather than leaving them implicit. A useful specification might state:
- Signals are confirmed at the close of a 15-minute bar.
- Orders become active on the next event.
- Entries use market orders with modeled slippage.
- Protective stop and target orders activate only after entry confirmation.
- If chronology cannot be resolved, the stop receives priority.
- Gaps through stops fill at the next available modeled price.
The Kvants Studio platform can translate plain-English ideas into editable strategy logic and run backtests on NautilusTrader’s event-driven engine. Event-driven processing helps preserve order chronology and state, but it cannot recover detail absent from the input data. Data resolution and execution assumptions still need to match the strategy.
After establishing a baseline, parameter sweeps can test nearby stop and target values. Walk-forward analysis and crisis-stress validation can then evaluate whether the rules remain stable outside the period used to develop them. The Kvants documentation provides guidance on strategy logic and research workflows.
Frequently Asked Questions
What is intrabar backtesting?
Intrabar backtesting simulates events within a larger strategy candle using finer-resolution market data or explicit sequencing assumptions. Its purpose is to model when orders became active and which eligible order was triggered first.
Do I need tick data for accurate backtesting?
Not always. The required resolution depends on the strategy. Daily or hourly data may be adequate for systems with widely spaced levels and next-bar execution. Short-term strategies with tight bracket orders may require minute, tick, or quote data. Even tick data cannot perfectly reconstruct queue position or market impact.
What should happen if the stop and target are hit in the same candle?
Use finer data if it can reveal the order. If chronology remains unknown, apply a disclosed policy such as adverse priority, exclusion, or an outcome range. Do not silently select the profitable result.
Is event-driven backtesting the same as intrabar backtesting?
No. Event-driven backtesting processes market and order events in sequence. Intrabar backtesting concerns the detail available inside an aggregated candle. An event-driven engine can model chronology only to the extent that the supplied data and assumptions expose it.
How do I know whether same-bar ambiguity matters?
Count affected trades and rerun the test under adverse and favorable ordering. Compare expectancy, drawdown, win rate, and total results. Large differences indicate that the apparent edge depends heavily on unresolved execution.
Risk Note
This article is educational and is not investment advice. Backtests simplify market behavior, and backtested performance does not guarantee future results. Data quality, liquidity, latency, fees, slippage, and live order handling can produce outcomes that differ materially from a simulation.