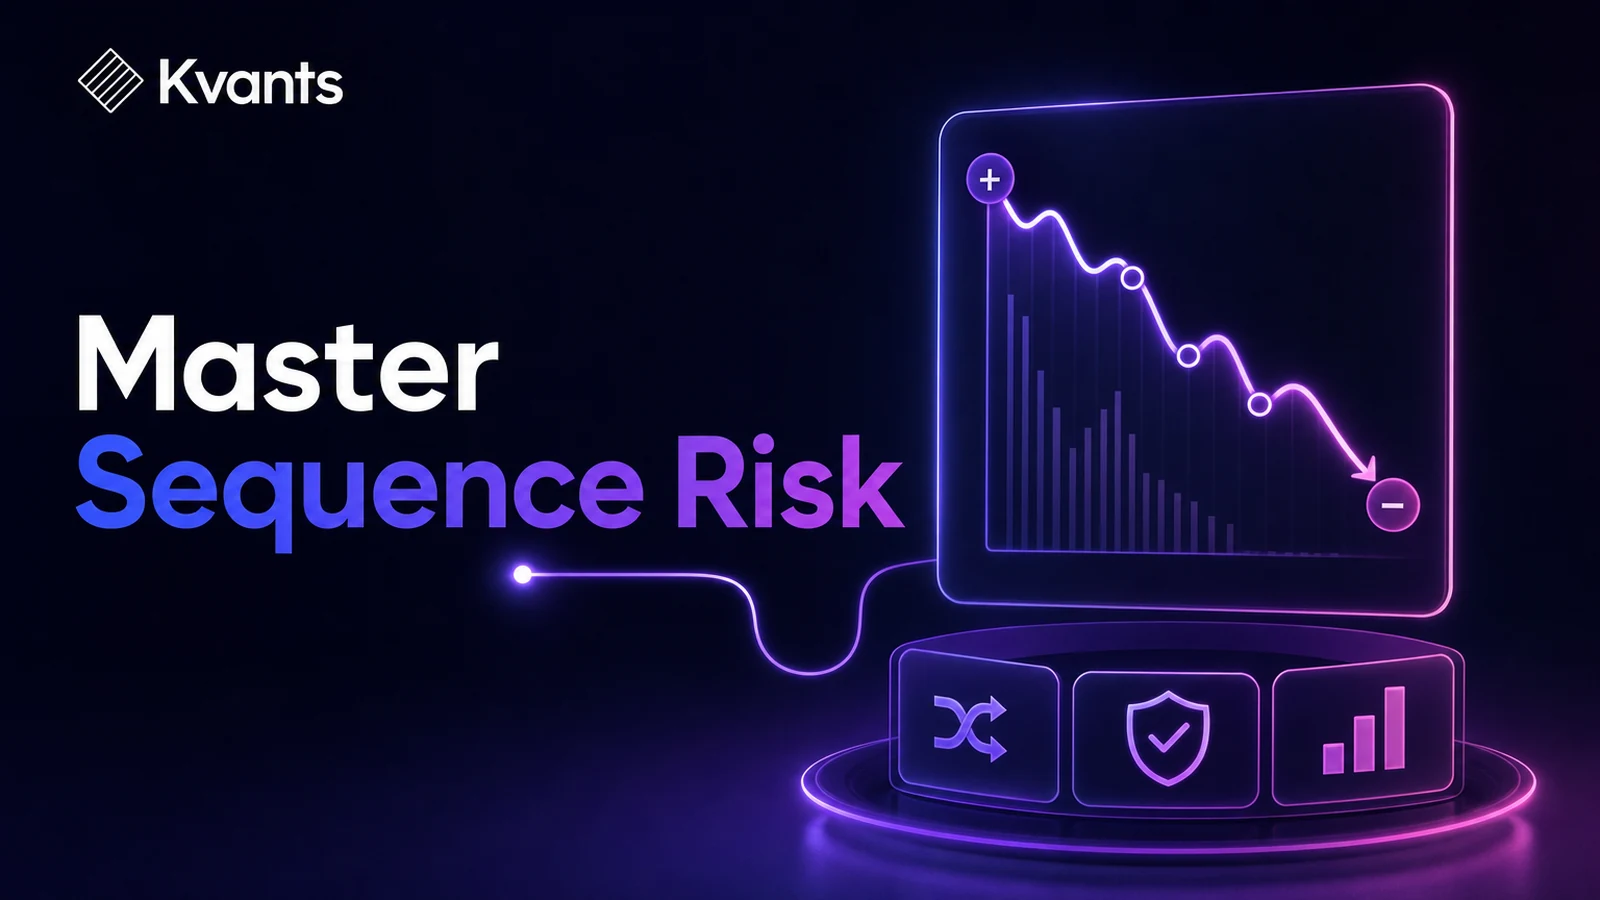
Learn how sequence risk changes drawdowns without changing a strategy’s trades, then use resampling, realistic thresholds, and position sizing to test whether the path is survivable.
Quick Answer
Sequence risk in trading is the risk that wins and losses arrive in an unfavorable order. Two traders can take the same set of trades and finish with the same result, yet one may experience a much deeper interim drawdown or breach an account limit because losses cluster together. Measure it by resampling historical trade outcomes into many plausible sequences, recording drawdowns and threshold breaches, and repeating the test at different position sizes. The main limitation is that resampling reflects the quality and assumptions of the original trade data; it cannot reveal market conditions absent from the sample.
Key Takeaways
- A positive backtest can still contain an unacceptable range of possible drawdown paths.
- Rearranging the same trades changes drawdown depth, losing streaks, and rule breaches even when the final result is unchanged.
- Use actual net trade outcomes rather than only win rate and average reward-to-risk.
- Test account-specific failure thresholds, not an arbitrary definition of ruin.
- Position size is usually the most direct lever for reducing sequence risk.
- Resampling complements out-of-sample, walk-forward, and regime testing; it does not replace them.
What Sequence Risk in Trading Actually Means
A standard backtest presents trades in the order they occurred historically. That order is only one realized path.
Suppose a strategy produced 100 trades containing a particular combination of winners and losers. If the losses were spread evenly through the test, the equity curve might look stable. If the same losses arrived in one cluster, the strategy could experience a drawdown large enough to trigger a daily loss limit, violate a prop firm rule, cause a margin problem, or persuade the trader to abandon it.
The underlying expectancy has not necessarily changed. The path has.
Sequence risk matters whenever the path affects what happens next. Common examples include:
- Position size changes with account equity.
- Trading stops after a drawdown threshold is reached.
- An account has a maximum or trailing drawdown rule.
- Capital is withdrawn during the trading period.
- A trader reduces size or overrides rules after consecutive losses.
- Several strategies lose together during the same market regime.
This is why the final return alone is an incomplete measure of risk. A strategy must remain executable long enough for its statistical edge—if it has one—to matter.
Every Kvants strategy keeps an evolving brain.
A Worked Example: Same Trades, Different Experience
Consider these ten outcomes, measured in R, where 1R is the amount initially risked on a trade:
+2R, +1.5R, +1R, -1R, -1R, -1R, -1R, +2R, -1R, +1.5R
The combined result is +3R.
Now arrange the five losses first:
-1R, -1R, -1R, -1R, -1R, +2R, +1.5R, +1R, +2R, +1.5R
The strategy falls 5R before recovering. A trader risking 2% of starting equity per R would face an approximate 10% decline before considering compounding, slippage, or changing account equity.
Arrange the same outcomes more evenly:
+2R, -1R, +1.5R, -1R, +1R, -1R, +2R, -1R, +1.5R, -1R
This path still finishes at +3R, but its peak-to-trough drawdown is only 1R.
Neither sequence proves what will happen next. The example shows why one historical ordering cannot describe the full path risk contained in a strategy’s outcomes.
The endpoint also requires careful interpretation. With fixed R outcomes, rearranging the trades preserves the total. With percentage-based compounding, the same set of percentage returns also has the same mathematical endpoint if every trade is taken and no constraints intervene. In practice, order still matters because drawdown limits, minimum trade sizes, margin requirements, withdrawals, and trader decisions can interrupt the path.
A Step-by-Step Sequence-Risk Workflow
1. Build a trustworthy trade series
Start with trade-level results from a backtest or trading journal. Each record should include the net outcome after commissions, fees, spread, and modeled slippage.
Use a consistent unit:
- R-multiples are useful when initial risk is clearly defined for every trade.
- Percentage returns are useful when position size varies with equity.
- Currency P&L can work for fixed-size strategies but may become misleading when account size changes.
Do not reduce the data to win rate and average win or loss. Averages erase outliers, partial exits, variable losses, and the shape of the return distribution.
2. Define what failure means
“Ruin” does not always mean the account reaches zero. The relevant threshold could be:
- A maximum permitted drawdown
- A daily loss limit
- A trailing equity floor
- A margin threshold
- A personal stop-trading level
- A drawdown that would require an impractical recovery
Choose the threshold before examining simulated results. Otherwise, it is easy to move the boundary until the strategy appears acceptable.
3. Choose an appropriate resampling method
Three methods answer different questions.
Random permutation rearranges the observed trades without changing their frequency. It isolates ordering risk within the historical sample. Every path contains exactly the same trades, so the final uncompounded R total remains constant.
Bootstrap resampling draws trades from the sample with replacement. Some outcomes may appear several times while others may not appear at all. This tests both order and sampling variability, but it assumes the historical outcomes are reasonably representative.
Block resampling rearranges groups of consecutive trades rather than individual trades. It can preserve some short-term dependence, such as losses clustering during a particular regime. Block choice requires judgment, and it does not solve the problem of unseen regimes.
For a first diagnostic, permutation is easy to interpret. Bootstrap and block methods provide broader stress tests but introduce more assumptions.
4. Preserve the real sizing rule
Apply the same sizing logic intended for live trading. Examples include fixed dollar risk, fixed fractional risk, volatility-based sizing, or a rule that reduces exposure after a drawdown.
Do not simulate in R and then assume the result automatically represents account equity. Convert each outcome according to the actual sizing rule and recalculate equity after every trade.
If the account has a daily constraint, preserve timestamps or session groupings. Randomizing individual trades across imaginary days would make daily-limit estimates unreliable.
5. Run enough paths to stabilize the distribution
Generate many alternative paths and monitor whether the main percentiles stop changing materially as the number of simulations increases. The objective is not to produce an impressively large number of runs. It is to obtain stable estimates under clearly documented assumptions.
For every path, record at least:
- Maximum drawdown
- Longest losing streak
- Time spent below the previous equity peak
- Lowest account equity
- Whether a defined limit was breached
- Final result, when the resampling method allows it to vary
6. Read the distribution, not the best path
The most favorable path is not a planning estimate. Focus on the median, adverse percentiles, and frequency of threshold breaches.
Ask practical questions:
- What drawdown appears in a large portion of paths?
- How severe are the less common but still plausible paths?
- How often does the planned size breach the account limit?
- Would the trader continue following the strategy through the observed losing streaks?
- Does reducing risk per trade materially improve survival?
Simulation probabilities are conditional on the model and sample. A reported breach frequency is not an objective probability for the future.
7. Repeat the test across position sizes
Run the same analysis at several risk levels. For example, compare the planned size with smaller alternatives rather than searching only for the largest size that narrowly avoids failure.
Look for a risk level with room for estimation error, higher trading costs, and worse-than-sampled conditions. If a small increase in size causes a large increase in breaches, the plan is fragile.
8. Validate beyond trade-order reshuffling
Sequence tests cannot determine whether the strategy logic remains valid in new markets. Follow them with:
- Out-of-sample testing
- Walk-forward analysis
- Different market regimes
- Crisis-period stress tests
- Higher cost and slippage assumptions
- Delayed or missed-entry scenarios
- Combined portfolio exposure tests
A strategy that survives rearranged trades but fails out of sample has not passed validation.
A backtest's equity curve and trade-by-trade log.
Common Sequence-Risk Failure Modes
Treating trades as independent when they are not
Trend, volatility, liquidity, and signal overlap can create clusters. Randomizing every trade independently may break those relationships and understate regime risk. Consider block resampling and separate regime analysis.
Using too little or biased data
A short sample may omit rare losses and adverse conditions. Resampling a weak sample thousands of times does not create new information; it repeats what the sample already contains.
Ignoring costs and execution
Gross outcomes make the distribution look better than the experience available after spread, commissions, slippage, and missed fills. Sequence analysis should begin with realistically modeled net results.
Mixing incompatible strategies
Combining unrelated systems into one trade list can hide where risk originates. Analyze each strategy first, then examine the portfolio with overlapping timestamps and shared market exposure preserved.
Optimizing position size to the simulation
Selecting the highest size that survives a chosen percentile is another form of fitting. Use simulations to identify sensitivity and establish a buffer, not to manufacture a precise “safe” number.
Treating simulations as forecasts
A resampled distribution describes outcomes under a particular set of assumptions. Structural market changes, execution failures, new regulations, or unprecedented events can produce results outside it.
Publishing a strategy to the Kvants marketplace.
Using Kvants in the Validation Process
Kvants Studio can turn a plain-English strategy idea into editable, auditable logic and test it on an event-driven engine. This helps establish the trade series and execution assumptions that a sequence-risk analysis depends on.
Within Kvants, traders can compare position-sizing parameters, perform parameter sweeps, and use walk-forward and crisis-stress validation. These tests answer different questions from trade-sequence resampling: they examine parameter sensitivity, changing test windows, and difficult historical periods rather than only rearranging existing outcomes.
If Monte Carlo or bootstrap analysis is required, treat it as a separate statistical layer applied to verified trade-level results. Document the resampling method, sizing logic, thresholds, and treatment of overlapping trades so the conclusions remain auditable. The Kvants documentation provides guidance on defining strategy logic and running the supported research workflow.
Frequently Asked Questions
Is sequence risk the same as risk of ruin?
No. Sequence risk concerns the order in which outcomes occur. Risk of ruin estimates the chance of crossing a defined failure threshold. An unfavorable sequence is one mechanism that can lead to ruin, especially when position sizing, leverage, or account rules amplify drawdowns.
How many trades do I need for sequence analysis?
There is no universal minimum. More observations generally describe the outcome distribution better, but relevance also matters. A large sample from one narrow regime may be less informative than a carefully segmented sample covering different conditions. Treat results from small samples as exploratory and use conservative assumptions.
Does Monte Carlo simulation predict my next drawdown?
No. It generates conditional scenarios from supplied data and assumptions. It can reveal that the historical drawdown was unusually mild or that the sizing plan is sensitive to clustered losses, but it cannot identify the exact size or timing of the next drawdown.
Should I shuffle individual trades or trading days?
Match the unit to the constraint. Shuffle individual trades to study basic ordering risk. Preserve days when testing daily loss limits, and preserve blocks when trade outcomes may be dependent. For overlapping positions, a portfolio-level timeline is usually more informative than an isolated trade list.
What should I change if too many paths breach my limit?
First reduce position size and rerun the analysis. Then examine concentration, correlated strategies, stop behavior, transaction costs, and exposure during adverse regimes. Do not simply remove inconvenient historical losses or redefine the threshold after seeing the result.
Risk Note
This article is educational and is not investment advice. Trading involves substantial risk, and simulated scenarios depend on historical data and modeling assumptions. Backtested performance does not guarantee future results. Use conservative sizing, verify execution assumptions, and consider whether any strategy is appropriate for your financial circumstances and account constraints.