Learn what options volume and open interest actually reveal, why high volume is not automatically bullish, and how to validate an options-flow hypothesis with price evidence.
Quick Answer
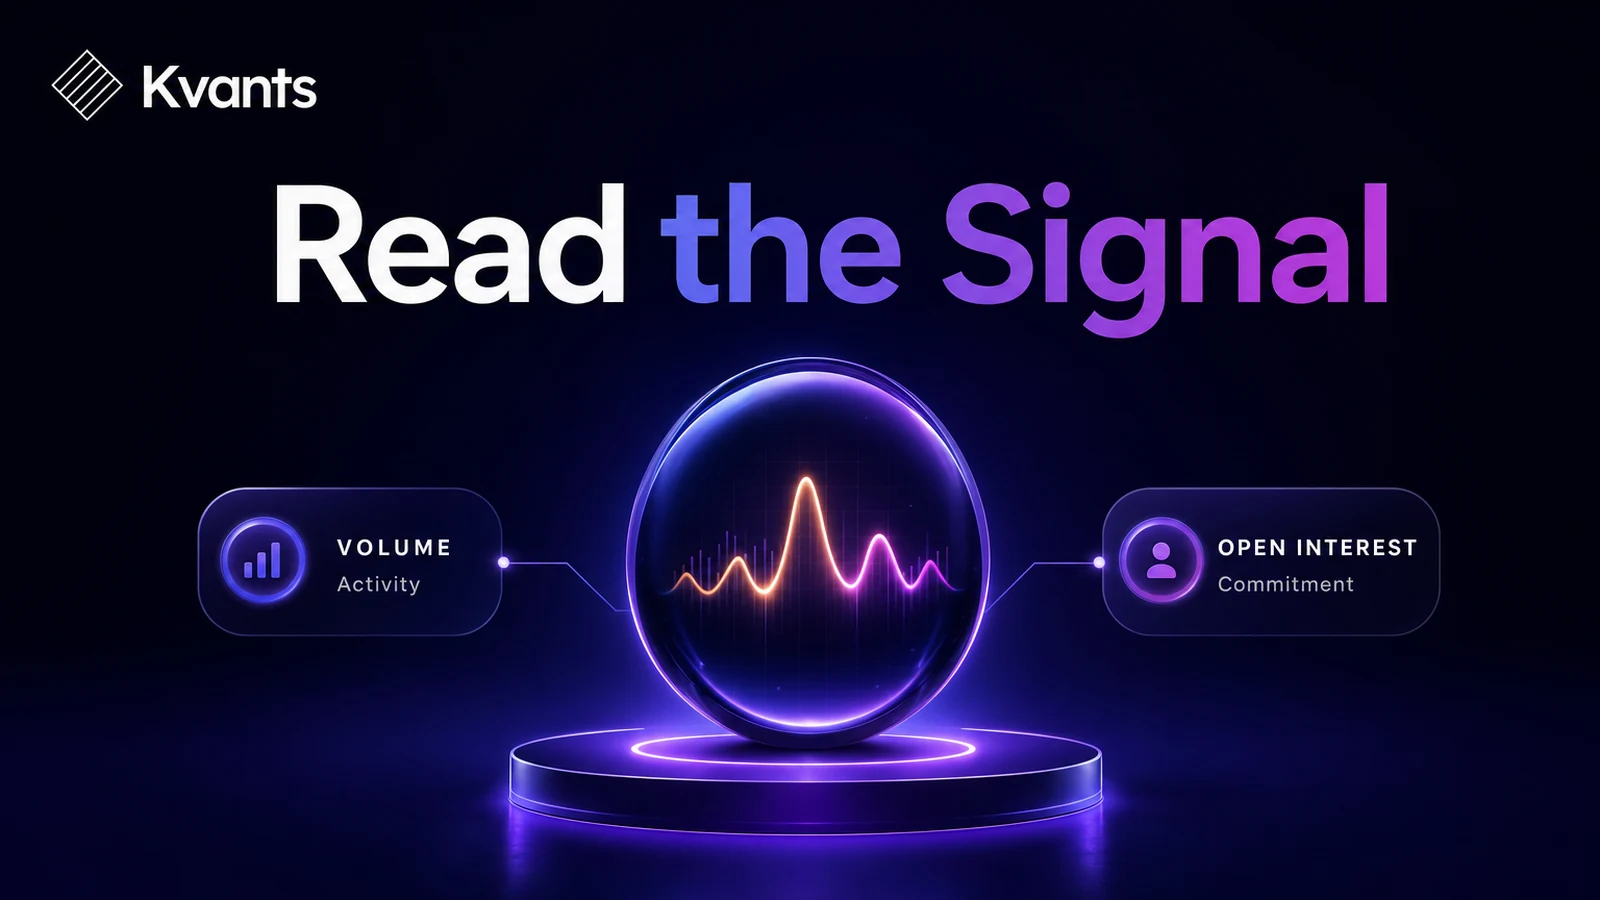
Options volume measures how many contracts trade during a session, while open interest measures how many contracts remain open after positions are created and closed. High volume relative to open interest can flag unusual activity, but it does not prove that a new bullish or bearish position was opened. Contracts may trade repeatedly, close existing positions, or form part of a multi-leg strategy. Treat the comparison as an attention signal, then examine execution price, contract selection, underlying price action, and later changes in open interest.
Key Takeaways
- Volume counts contracts traded today; open interest counts contracts still open.
- Volume greater than open interest does not, by itself, prove that traders are opening new positions.
- A call trade is not necessarily bullish, and a put trade is not necessarily bearish.
- Bid, ask, strike, expiration, and multi-leg context help explain intent but remain imperfect clues.
- The strongest workflow uses options activity to form a hypothesis and independent price evidence to confirm or reject it.
- Any repeatable signal should be tested with realistic entry timing, costs, exits, and out-of-sample data.
What Volume and Open Interest Actually Measure
Options volume is the number of contracts traded during the current session. It starts at zero each trading day and rises whenever contracts change hands. If one contract is traded five separate times, each transaction contributes to reported volume.
Open interest is the number of outstanding contracts that remain open. It changes when market participants create new contracts or close existing ones. It is not the same as daily trading activity, and it does not tell you whether outstanding positions are long or short.
Every options contract also has two sides. One participant’s long call is another participant’s short call. Open interest records that the contract exists, not which side has the more informed or directional view.
There is also a timing mismatch. Volume is visible during the session, while definitive open-interest changes are generally calculated after clearing. Intraday traders are therefore comparing current activity with a figure based on previously outstanding positions. That comparison can be useful, but it is not a live ledger of opening and closing trades.
Browsing tradeable signals in the research library.
How to Interpret Options Volume vs Open Interest
Use the relationship as a classification tool rather than a trade command.
Volume is high relative to open interest
This means the contract is trading more actively than its existing open-position base might suggest. It may reflect new positioning, a catalyst, closing activity, rolling positions, or repeated trading in the same contracts.
The observation is unusual activity—not confirmed accumulation.
Volume is low relative to open interest
This often describes an established contract with many outstanding positions but limited activity today. It does not mean the market has lost interest in the underlying thesis. Existing holders may simply be maintaining their positions.
Both volume and open interest are high
The contract is both actively traded and widely held. This may provide better liquidity, but popularity is not evidence that the next price move will favor buyers. Crowded hedges and market-making activity can also produce large figures.
Both are low
The contract may be illiquid. Quotes can be wide, fills can be poor, and a small number of trades can look statistically dramatic. A high volume-to-open-interest ratio based on tiny absolute numbers is usually less meaningful than substantial activity in a liquid chain.
Every Kvants strategy keeps an evolving brain.
A Step-by-Step Options Activity Workflow
1. Start with absolute activity
Do not screen on a ratio alone. Ten contracts of volume against one contract of open interest produces a ratio of 10, but the absolute activity may still be immaterial.
Record contract volume, open interest, quoted spread, and total premium traded. The purpose is to distinguish genuinely concentrated activity from a mathematically large ratio created by a small denominator.
2. Identify the contract precisely
Record the underlying, call or put, strike, expiration, trade time, and execution price. Moneyness and time to expiration materially change what a trade may represent.
A short-dated out-of-the-money call may be a speculative directional bet. The same call could also hedge a short stock position or form one leg of a spread.
3. Inspect where the trade executed
A trade near the ask is consistent with an aggressive buyer, while a trade near the bid is consistent with an aggressive seller. “Consistent with” matters: quotes can change, reporting can be delayed, and complex orders can make individual legs misleading.
Execution location improves the inference, but it does not reveal the trader’s complete portfolio.
4. Look for multi-leg activity
Trades printed at similar times across different strikes or expirations may belong to one spread, roll, or hedge. Reading one leg in isolation can reverse the apparent meaning.
For example, buying one call and selling a higher-strike call is not equivalent to an outright call purchase. Both legs may appear as large call activity, yet the combined position has capped upside and different risk.
5. Check the underlying market
Compare the activity with the stock’s trend, relative volume, nearby support or resistance, volatility, and known scheduled events. Options activity that agrees with independent price evidence is easier to define and test than activity interpreted without context.
This does not make the signal correct. It simply turns an ambiguous observation into a clearer hypothesis.
6. Review the next open-interest update
If open interest rises substantially after the session, that supports the idea that net new contracts were created. If it falls, closing activity likely played an important role.
Even then, the change does not establish bullish or bearish intent. It confirms a change in outstanding positions, not the direction of the informed side.
7. Define confirmation, invalidation, and risk
Before trading, specify what the underlying must do. A rule might require a close above a prior range, above-average stock volume, or a breakout that holds for a defined period.
Also define what rejects the idea. Without an invalidation rule, “following flow” can become a justification for holding after the original evidence has failed.
Worked Example: From Activity to a Testable Hypothesis
Assume a stock is trading at $48. A $50 call expiring in six weeks records 8,000 contracts of volume against 1,200 contracts of prior open interest. Much of the volume appears near the ask.
The weak conclusion is: “Large traders bought calls, so the stock will rise.”
A more defensible interpretation is:
- The contract experienced unusually high activity relative to its prior open positions.
- Ask-side execution is consistent with aggressive call buying.
- The expiration gives the thesis several weeks, but the position could still be a hedge or part of a spread.
- The activity creates a bullish hypothesis, not a confirmed bullish trade.
The trader could convert that hypothesis into stock-side rules:
- Enter only if the stock closes above $50 on higher-than-normal share volume.
- Place the initial invalidation below the breakout level or another predefined structural point.
- Exit after a fixed holding period, on a price target, or when the invalidation condition occurs.
- Skip the trade if the breakout happens through a large overnight gap that makes the planned risk impractical.
These rules are illustrative, not recommendations. Their value is that they separate the observed options activity from the conditions required to act.
Common Failure Modes
Assuming calls are bullish and puts are bearish
Calls can be sold, and puts can be sold. Either contract can hedge another exposure. Contract type alone does not reveal the complete position.
Treating volume above open interest as proof of a new position
Volume counts transactions, including repeated trading and closing activity. The ratio identifies activity that deserves investigation; it does not classify every contract as newly opened.
Ignoring spreads and rolls
A dramatic individual print may be one leg of a neutral, capped, or volatility-focused strategy. Check nearby strikes and expirations for related trades.
Following premium size without considering liquidity
A large notional trade can still occur in a wide market. Estimated execution quality and the ability to exit matter, especially in less liquid contracts.
Entering after the underlying has already moved
By the time activity becomes visible, the stock or option may have repriced. Chasing changes the entry, stop distance, and expected payoff. The original trader’s position may remain sensible while the follower’s entry is poor.
Selecting only memorable winners
Unusual activity produces many false or ambiguous signals. Reviewing only trades followed by large moves creates hindsight bias. A valid evaluation must include every signal that met the rules.
Turning the Observation Into a Research Process
Options flow is most useful as a source of hypotheses. To evaluate one, define the observation without subjective language: minimum contract volume, maximum prior open interest, expiration range, moneyness, and acceptable spread. Then define a separate confirmation rule using the underlying stock.
Testing must respect information timing. A backtest should not act on end-of-day totals before they would have been known. It also needs realistic entries, transaction costs, exits, and rules for overlapping signals.
Kvants Studio can help translate the stock-side portion of the idea from plain English into editable, auditable strategy logic. Traders can use its event-driven backtesting, parameter sweeps, walk-forward analysis, and crisis-stress validation to examine confirmation and risk rules rather than relying on a few compelling charts.
Keep the boundary clear: a stock backtest does not prove that the original options trader had a particular motive. It tests whether your defined, observable rules historically produced a useful distribution of outcomes. The Kvants research guides provide additional workflows for backtesting, validation, and risk analysis.
A strategy laid out end to end in the Kvants editor.
Frequently Asked Questions
Is volume higher than open interest bullish?
No. It indicates heavy activity relative to previously outstanding contracts. Direction depends on whether contracts were bought or sold, the position’s other legs, and the trader’s broader exposure. Even apparent ask-side call buying is evidence of aggressive demand, not proof of a future rally.
Can volume exceed open interest?
Yes. Volume counts every contract transaction during the session, while open interest counts outstanding contracts from the relevant reporting cycle. The same contracts can trade multiple times, so daily volume can exceed open interest without every trade creating a new position.
Does rising open interest confirm a new position?
It confirms that the number of outstanding contracts increased on a net basis. It does not identify which participant has the directional view or whether the position is speculative, hedged, or part of a spread.
What matters more: options volume or open interest?
Neither is universally more important. Volume describes current activity, while open interest describes outstanding participation. Liquidity analysis often uses both, along with quoted spreads and contract volume. Directional analysis requires additional context.
Should options activity be used as an entry signal?
It can be one component of a defined strategy, but using it alone leaves major ambiguities unresolved. A more robust process adds underlying-price confirmation, an invalidation condition, position sizing, and a tested exit rule.
Risk Note
This article is educational and is not investment advice. Options and short-term trading involve substantial risk, including the possible loss of the full amount committed to a position. Options activity can be delayed, incomplete, or misinterpreted, and another trader’s position may be part of an unseen hedge or spread. Backtested performance does not guarantee future results. Kvants is a research tool, not an investment adviser, and does not guarantee performance.