Learn how walk-forward analysis tests a trading strategy across successive unseen periods, including window design, parameter selection, failure modes, and interpretation.
Quick Answer
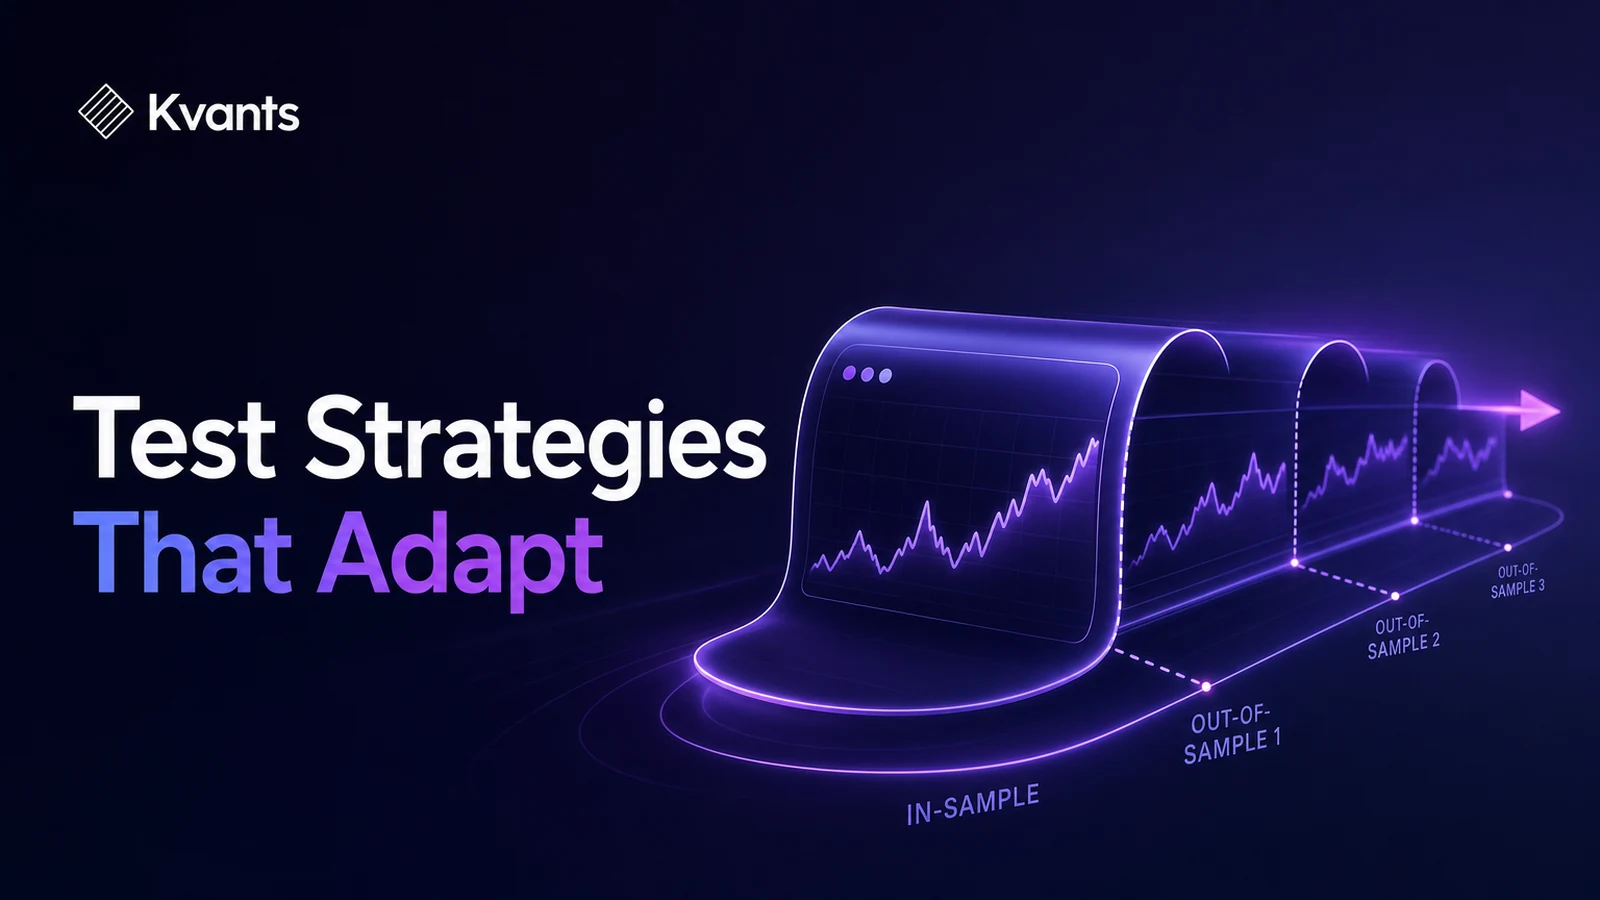
Walk-forward analysis tests a trading strategy by repeatedly selecting its parameters on an earlier training period and then applying those parameters to a later, unseen test period. After each test, both windows move forward and the process repeats.
The method can reveal whether a strategy adapts consistently or succeeds only in one historical sample. Its main limitation is that results still depend on realistic data, execution assumptions, window choices, and an objective parameter-selection process. Walk-forward testing reduces some forms of overfitting; it does not eliminate them.
Key Takeaways
- Each walk-forward cycle separates parameter selection from out-of-sample evaluation.
- Parameters must be chosen using only information available before the corresponding test period.
- Window length should reflect the strategy’s trading frequency and the expected lifetime of its market behavior.
- Aggregate performance is not enough; inspect stability across individual test windows and parameter choices.
- Costs, latency, liquidity, and position-sizing rules must remain realistic throughout the process.
- A weak walk-forward result is useful evidence that a strategy needs revision, simplification, or rejection.
What Walk-Forward Analysis Actually Tests
A conventional backtest often applies one fixed strategy configuration across the entire historical period. That can estimate how those rules would have behaved, but it does not necessarily reproduce the research process used to choose them.
Suppose a trader tests moving-average lengths from 10 to 100 days and selects the most profitable combination using ten years of data. Reporting the performance of that winning combination on the same ten years creates an optimistic estimate. The historical data influenced both the strategy selection and its evaluation.
Walk-forward analysis separates those jobs:
- Training window: Test eligible parameter combinations using past data.
- Selection rule: Choose a configuration according to a predefined objective.
- Test window: Apply that configuration to the next unseen period without changing it.
- Advance: Move the windows forward and repeat.
The results from all test windows are then joined into a walk-forward out-of-sample record. This approximates a trader periodically reviewing a strategy, selecting settings from the evidence then available, and using those settings until the next scheduled review.
The process tests more than raw performance. It also tests whether the research and re-selection procedure is repeatable.
Configuring a backtest in Kvants Studio.
How Walk-Forward Windows Work
Every walk-forward design requires a training-window length, a test-window length, and a rule for advancing through time.
A rolling window keeps the training period at a fixed length. When the analysis advances, old observations leave the training set as new observations enter. This can help a strategy respond to changing conditions, but it discards older evidence and may produce unstable settings when recent data is noisy.
An anchored window begins at the same historical date and expands at each cycle. It uses an increasing amount of evidence, which can make parameter estimates more stable. Its limitation is that old market behavior continues to influence every later decision, even when market structure has changed.
Neither design is universally preferable. Use the structure that reflects how the strategy would actually be maintained. If you intend to recalibrate using only the most recent two years, test a rolling two-year process. If you intend to retain all available history, an anchored design is more faithful.
Window lengths also need enough observations. Six months may contain many trades for an intraday strategy but only a handful for a slow trend-following system. Calendar duration alone is therefore an incomplete guide. Check the number and diversity of trades in every window.
Worked Example: A Rolling Breakout Test
Consider a hypothetical daily breakout strategy for liquid stocks. It buys when price closes above the highest close of the previous N sessions and exits after a close below a shorter trailing low. The research question is whether the breakout lookback should be 20, 40, or 60 sessions.
The trader defines the following process before seeing the results:
- Train on the previous 36 months.
- Test each eligible lookback using identical cost and risk assumptions.
- Select the setting with the highest risk-adjusted return, provided it also satisfies a maximum-drawdown constraint.
- Hold the chosen setting fixed for the next six months.
- Advance both windows by six months and repeat.
In the first cycle, the 40-session lookback is selected from the training data and tested over the next six months. In the second cycle, the training window advances by six months. The best eligible setting may remain at 40 or change to 20 or 60.
The important output is not whether one lookback wins most often. The trader should ask:
- Did most out-of-sample windows produce acceptable behavior?
- Did losses concentrate in one market regime?
- Were selected parameters clustered in a sensible region or jumping between extremes?
- Did small changes to the selection rule materially change the result?
- Was turnover—and therefore estimated cost—stable?
If the combined test record looks strong only because one six-month window produced an exceptional gain, the evidence is fragile. If neighboring parameters behave similarly and several independent windows contribute, the result is more credible, though still uncertain.
A Step-by-Step Walk-Forward Analysis Workflow
1. Freeze the strategy definition
Write down the market universe, signal timing, entry and exit rules, sizing method, costs, and data requirements. Separate fixed rules from parameters that may be recalibrated.
Do not quietly change the strategy after inspecting each test window. Any substantive revision creates a new research version that requires fresh validation.
2. Define the permitted parameter space
Choose ranges for defensible reasons rather than searching every imaginable value. For example, test lookbacks representing short-, medium-, and longer-term behavior instead of hundreds of nearly identical values.
A very large search space increases the chance of discovering a configuration that fits noise. Parameter sweeps should investigate a hypothesis, not manufacture one.
3. Choose training and test windows
Use enough training observations to estimate the strategy’s behavior while keeping the period relevant to the intended recalibration schedule. The test window should be long enough to contain meaningful evidence but short enough to reflect how often settings would be reviewed.
Decide whether windows overlap. Overlapping test periods can make observations less independent, so interpret them accordingly.
4. Specify the selection objective
“Choose the best strategy” is not a reproducible rule. Define the metric, constraints, and tie-breaking process in advance.
A selection rule might maximize net expectancy while requiring a minimum trade count and limiting historical drawdown. Avoid relying on one metric without considering how it can be distorted. For example, a high risk-adjusted result based on very few trades may not be dependable.
5. Run each cycle without leakage
At every cutoff date, use only data that would have been available then. This includes price data, universe membership, corporate actions, and any fundamental or alternative inputs.
Select the parameters on the training window, lock them, and evaluate the following test window. Do not replace disappointing test settings after seeing what happened.
6. Join and inspect the test windows
Combine the sequential out-of-sample trades while preserving each window label. Calculate net returns, drawdown, trade count, expectancy, exposure, turnover, and other metrics relevant to the strategy.
Then inspect the distribution across windows. Consistency does not require every period to be profitable, but the aggregate result should not conceal severe dependence on one period, instrument, or parameter choice.
7. Stress the research procedure
Repeat the analysis with reasonable variations in window length, recalibration frequency, costs, and nearby parameter ranges. This is a robustness check, not an invitation to keep searching until the result looks attractive.
If minor methodological changes reverse the conclusion, treat that sensitivity as evidence against deployment.
Deploying a strategy to paper or live with a pre-flight gate.
Common Failure Modes
Reusing test windows for development
Once an out-of-sample period influences a rule change, it is no longer truly unseen. Repeatedly revising the strategy against the same test history turns the test set into another training set.
Optimizing too many choices
Lookbacks are not the only optimized variables. Traders may also select the universe, timeframe, costs, filters, objective metric, and window schedule after viewing results. Those hidden degrees of freedom can create overfitting even when each cycle is technically separated.
Selecting unstable peaks
The single highest-performing parameter can sit on a narrow, noisy peak. Prefer configurations supported by a stable neighborhood of similar settings. A broad region of comparable behavior is usually more defensible than one isolated optimum.
Ignoring execution realism
Walk-forward analysis cannot repair unrealistic fills. Signals should respect bar timing, orders should be processed in the correct sequence, and assumptions should account for fees, spread, slippage, liquidity, and position limits where relevant.
Treating adaptation as protection
Frequent recalibration can make a model chase recent noise. A parameter that changes every month is not necessarily adapting intelligently. Stability, turnover, and the economic meaning of each change matter.
Interpreting the Final Result
A walk-forward report is evidence about a process, not a pass-or-fail certificate. A useful review should cover four questions.
First, is the combined out-of-sample result acceptable after estimated costs? Second, how much did results vary between windows? Third, were selected parameters reasonably stable? Fourth, does the result survive modest changes to the research design?
Possible decisions include:
- Continue validation: Results are reasonably distributed and robust enough for further stress testing.
- Simplify: The core idea may persist, but complex filters or frequent recalibration add little value.
- Gather more evidence: Trade counts or market conditions are too limited for a clear conclusion.
- Reject: Out-of-sample behavior fails the predefined requirements.
Rejecting a strategy is a productive research outcome. It can prevent a polished in-sample chart from being mistaken for durable evidence.
Running Walk-Forward Research in Kvants
Quant Strategy Studio turns plain-English trading ideas into editable, auditable strategy logic. Traders can define a stock or crypto strategy, inspect the generated rules, run parameter sweeps, and apply walk-forward or crisis-stress validation.
Backtests run on NautilusTrader’s event-driven engine. That supports a workflow in which signal timing, order behavior, costs, and risk rules are represented explicitly rather than evaluated only through a static chart calculation.
The practical benefit is traceability: the strategy version, parameter candidates, and validation procedure can be reviewed before moving toward controlled paper or live workflows. Pine Script v6 export is also supported when that fits the research process. Product guidance and workflow details are available in the Kvants documentation.
Regardless of the tool, preserve the separation between development and evaluation. Software can execute a walk-forward design consistently, but the trader remains responsible for choosing defensible rules and interpreting uncertainty.
A strategy laid out end to end in the Kvants editor.
Frequently Asked Questions
Is walk-forward analysis the same as out-of-sample testing?
Walk-forward analysis is a form of repeated out-of-sample testing. A simple split uses one training period followed by one test period. Walk-forward analysis performs multiple train-select-test cycles through time, producing several sequential test windows.
How long should a walk-forward window be?
There is no universal length. It depends on trading frequency, trade count, regime diversity, and how often the strategy will be recalibrated. Each training window needs enough relevant observations, while each test window must provide meaningful evidence without contradicting the intended review schedule.
Should parameters be optimized in every cycle?
Only if periodic recalibration is part of the proposed strategy process. If the live plan uses fixed parameters, repeatedly optimizing them in the backtest answers a different question. Validation should mirror the process you intend to follow.
What metrics should I use to select parameters?
Use metrics aligned with the strategy’s objective and risks, such as net expectancy, drawdown, turnover, exposure, or a risk-adjusted measure. Add minimum evidence requirements and constraints. Avoid selecting parameters from gross return alone.
Can walk-forward analysis prevent overfitting?
No. It reduces direct reuse of the same observations for selection and evaluation, but overfitting can still enter through excessive parameters, repeated strategy revisions, unrealistic assumptions, or choosing the walk-forward design after viewing results.
What should I do after a strategy passes?
Run additional sensitivity and stress checks, document the final rules, and consider a controlled paper-trading phase. Monitor whether actual signal frequency, fills, costs, and risk behavior resemble the tested assumptions before considering live use.
Risk Note
This article is educational and is not investment advice. Trading involves risk, and backtested performance does not guarantee future results. Walk-forward analysis can improve research discipline, but it cannot predict market changes or remove model, data, liquidity, execution, and behavioral risks. Kvants is a research tool, not an investment adviser, and does not guarantee performance.