Learn how to compare trading strategies fairly using risk, expectancy, stability, costs, and practical constraints rather than choosing the highest backtested return.
Quick Answer
A fair trading strategy comparison tests both systems on equivalent data, costs, execution assumptions, and position-sizing rules. Compare expectancy, drawdown, stability, trade frequency, cost sensitivity, and operational demands—not just total return. The better choice is the strategy that survives realistic validation and fits your capital, risk limit, schedule, and execution ability. There is no universal winner: historical results are sample-dependent, and a strategy that looks stronger in one period may be less robust or less practical to trade.
Key Takeaways
- Freeze both strategy definitions before comparing their results.
- Use the same market data, test dates, costs, starting capital, and execution model.
- Compare return and risk as distributions, not isolated headline figures.
- Reject any strategy that violates a non-negotiable capital, drawdown, or scheduling constraint.
- Stress costs and uncertain execution, especially for high-turnover strategies.
- Validate the preferred strategy on unseen data and in paper trading before considering live use.
What Makes a Trading Strategy Comparison Fair?
Two backtest reports are not automatically comparable. One might assume entries at the closing price while the other enters on the next bar. One may include commissions and slippage while the other ignores them. Different test periods, position sizes, asset universes, or reinvestment rules can also create a misleading gap.
Before judging the strategies, align these inputs:
- Market and universe: Use the same instruments or apply equivalent eligibility rules.
- Test period: Include the same start and end dates, including difficult market conditions where possible.
- Data resolution: Do not compare an intraday model using minute data with another model tested only on daily bars without accounting for the difference.
- Starting capital: Keep capital and leverage assumptions consistent.
- Position sizing: Compare equal risk budgets rather than arbitrary share quantities.
- Trading costs: Apply commissions, fees, spreads, slippage, and financing costs where relevant.
- Order handling: Define when signals become orders, when orders can fill, and how stops and targets behave within a bar.
- Portfolio rules: Apply the same limits for simultaneous positions, total exposure, and correlated trades.
If these conditions differ, you may be comparing test configurations rather than trading ideas.
A Step-by-Step Trading Strategy Comparison Workflow
1. Write down your hard constraints
Start with what the strategy must not violate. Examples include a maximum acceptable drawdown, limited trading hours, restrictions on overnight positions, available capital, or a minimum number of opportunities.
Separate hard constraints from preferences. “Must not require monitoring during work hours” is a constraint. “I would prefer more trades” is a preference.
A strategy that fails a hard constraint should not advance merely because its return is higher.
2. Freeze each strategy specification
Document the market, timeframe, indicators, entry conditions, exits, position sizing, trading schedule, and order behavior. Ambiguous language such as “enter near support” must become an observable rule before testing.
This prevents the comparison from turning into an endless contest in which the weaker strategy is repeatedly modified after its results are known.
3. Build a common test environment
Run both systems using matching assumptions. Where exact equivalence is impossible, document the difference and its likely effect.
For example, a market-order breakout strategy and a limit-order pullback strategy have different fill risks. Giving both guaranteed fills would not make the comparison fair. Each needs a realistic execution model, but both should face a comparable standard of evidence.
4. Compare core performance dimensions
Use several dimensions rather than compressing the decision into one number:
- Expectancy: Average profit or loss per trade, preferably expressed in units of initial risk, or R.
- Maximum drawdown: The largest historical peak-to-trough decline. Treat it as an observation, not a guaranteed future ceiling.
- Drawdown duration: How long the strategy remained below its prior equity peak.
- Trade count: More observations can improve confidence, although quantity does not fix biased data.
- Win/loss distribution: Look for dependence on a few unusually large winners or losses.
- Exposure: How much time and capital the strategy keeps at risk.
- Turnover and cost sensitivity: Frequent trading can make small cost errors consequential.
- Consistency across periods: Examine yearly, quarterly, regime, and out-of-sample results instead of relying only on the full-period average.
5. Stress the assumptions
A strategy should not depend on one perfectly chosen configuration. Recalculate results with less favorable slippage, delayed entries, wider spreads, missed trades, and modest parameter changes.
The goal is not to manufacture an impossibly harsh scenario. It is to discover whether a small and plausible change destroys the apparent edge.
6. Validate on unseen data
Use out-of-sample or walk-forward testing after strategy development. Keep the final evaluation segment separate from parameter selection.
If you inspect the unseen period and then repeatedly revise the rules against it, it is no longer unseen. Set a limited revision policy before looking at the results.
7. Apply the constraint-first decision rule
Use this order:
- Eliminate strategies that fail hard constraints.
- Eliminate strategies that fail execution or cost stress tests.
- Compare the remaining strategies on risk, stability, and expectancy.
- Use personal preferences only as a final tie-breaker.
This prevents an attractive return figure from overriding practical incompatibility.
A backtest's equity curve and trade-by-trade log.
Build a Strategy Comparison Scorecard
A scorecard makes trade-offs visible without pretending that every trader should assign them the same importance.
| Comparison dimension | Best For | Main Limitation |
|---|---|---|
| Expectancy per trade | Comparing the average payoff of systems with normalized risk | Can be distorted by a small number of extreme trades |
| Maximum drawdown | Assessing historical capital decline and psychological demands | Future drawdown can exceed the backtest |
| Drawdown duration | Evaluating how long capital and confidence may remain under pressure | Highly dependent on the selected test period |
| Cost sensitivity | Comparing high-turnover or short-horizon systems | Cost estimates may not capture every live condition |
| Walk-forward stability | Checking whether results persist through repeated unseen periods | Short windows can produce noisy estimates |
| Trade frequency | Matching a strategy to opportunity needs and review cadence | More trades do not necessarily mean better evidence or returns |
| Operational complexity | Assessing whether the trader can execute the system consistently | Some burdens are difficult to quantify |
Do not create a weighted total until you establish rejection rules. Otherwise, a severe weakness can be hidden by several minor strengths. For example, strong expectancy should not compensate for a drawdown that exceeds available risk capital.
Configuring a backtest in Kvants Studio.
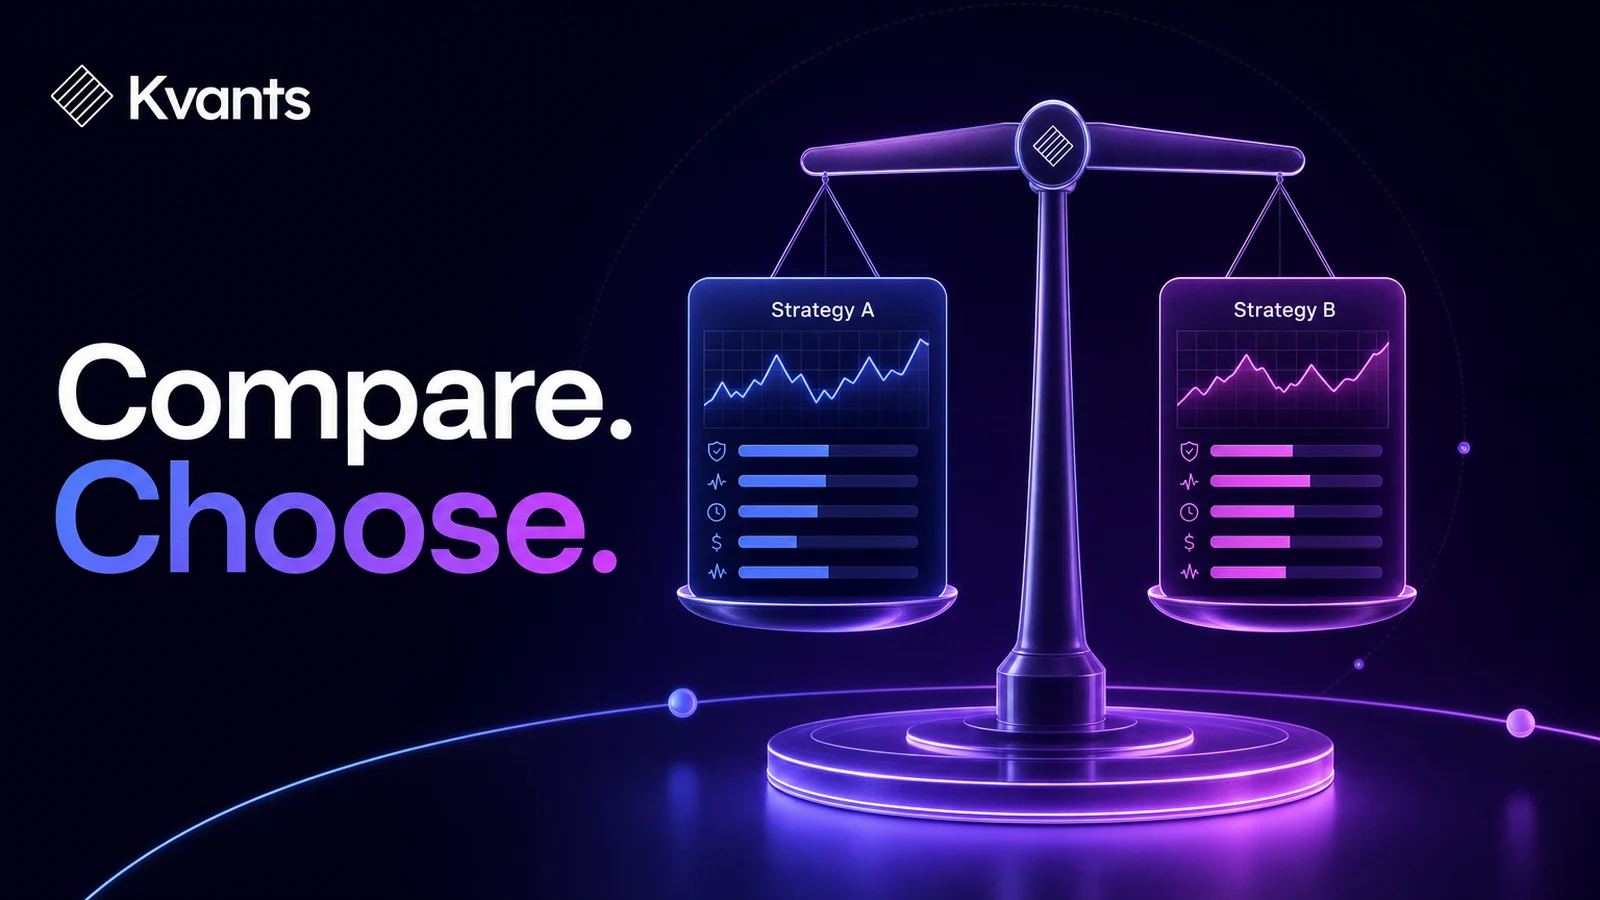
Worked Example: Choosing Between Strategy A and Strategy B
Consider two hypothetical strategies tested on the same instruments, dates, capital, risk per trade, and cost model.
| Metric | Strategy A | Strategy B |
|---|---|---|
| Trades | 180 | 92 |
| Expectancy | 0.18R | 0.25R |
| Maximum drawdown | -9R | -15R |
| Positive-expectancy walk-forward windows | 7 of 10 | 5 of 10 |
| Expectancy after higher cost assumptions | 0.08R | 0.22R |
| Monitoring requirement | Intraday | End of day |
Strategy B has higher expectancy and is less affected by the higher cost assumption. Strategy A has a smaller historical drawdown and remained positive across more walk-forward windows, but its edge is more sensitive to costs and it requires intraday monitoring.
Suppose the trader has a maximum strategy drawdown limit of 12R and cannot reliably monitor markets intraday. Strategy A fits the drawdown limit but fails the schedule constraint. Strategy B fits the schedule but exceeds the drawdown limit.
The correct conclusion is not to declare either strategy the winner. Neither currently fits all hard constraints. The trader could reduce Strategy B's risk allocation and retest the complete portfolio path, investigate an executable alert-based process for Strategy A, or reject both. Changing position size must trigger a new assessment of return, drawdown, minimum order size, and costs.
Common Comparison Failure Modes
Choosing the highest total return
Total return combines the strategy's edge with leverage, sizing, market exposure, and the specific test sequence. It says little about whether the path was tolerable or repeatable.
Comparing different market periods
A trend strategy tested during persistent trends may appear superior to a range strategy tested during choppy conditions. Use common dates, then segment results by market environment.
Optimizing one strategy more heavily
A strategy with hundreds of tested variations has received more opportunities to fit historical noise. Record the development process and parameter search, not just the final version.
Ignoring inactive capital
A low-exposure strategy may leave capital available for other uses, while a continuously invested strategy consumes that capacity. Compare exposure and portfolio interaction alongside standalone returns.
Treating the backtest drawdown as a limit
Maximum drawdown is the worst decline observed in that sample. It is not the worst decline that can occur. Stress tests and conservative risk limits remain necessary.
Changing criteria after seeing results
If the preferred metric changes whenever another strategy wins, the process is outcome-driven. Define constraints, metrics, and tie-breakers before opening the final reports.
Comparing Strategies in Kvants
In Kvants Studio, traders can turn plain-English ideas into editable, auditable strategy logic. Both strategies can then be tested through consistent assumptions on NautilusTrader's event-driven engine.
Parameter sweeps can show whether results depend on a narrow setting. Walk-forward and crisis-stress validation can examine performance beyond a single optimized period. After selecting a candidate, controlled paper workflows can help assess signals, order behavior, and operational demands before any live decision.
Keep a versioned record of each specification and test configuration. The Kvants documentation provides guidance on strategy logic and research workflows, while the Kvants blog covers related validation and risk concepts.
These tools improve research discipline; they do not determine whether a strategy is suitable or predict its future performance.
A strategy laid out end to end in the Kvants editor.
Frequently Asked Questions
Which metric is best for comparing trading strategies?
No single metric is sufficient. Start with hard risk and operational constraints, then compare expectancy, drawdown, drawdown duration, cost sensitivity, stability, exposure, and trade count together.
Should I compare strategies using dollars or percentages?
Use normalized measures where possible. R-multiples help compare trade outcomes under consistent initial risk, while percentage returns and drawdowns help assess the capital path. Dollar results can mislead when strategies use different account sizes or position sizing.
Can strategies with different trade frequencies be compared?
Yes, but compare more than average profit per trade. Include annualized opportunity, exposure, turnover, costs, drawdown duration, and the uncertainty created by different sample sizes. High frequency is neither inherently better nor worse.
How much backtest history is enough?
There is no universal duration. The sample should include enough trades and varied conditions to represent how the strategy is expected to operate. A long calendar history with few trades may still provide weak evidence, while many highly correlated trades may overstate the effective sample size.
Should I combine two strategies instead of choosing one?
Possibly, if their return drivers and loss periods are genuinely different. Test them as a portfolio with shared capital, simultaneous-position rules, correlated exposure, and portfolio-level costs. Combining two strategies does not automatically create diversification.
What if the preferred strategy fails in paper trading?
Investigate whether the cause is implementation, fills, costs, data differences, or rule ambiguity. Do not assume the backtest remains valid. Correct the issue, rerun the relevant tests, and restart the forward evaluation when the change is material.
Risk Note
This article is educational and is not investment advice. Trading involves risk, and losses can exceed expectations under changing market, liquidity, or execution conditions. Backtested performance does not guarantee future results. Kvants is a research tool, not an investment adviser, and does not guarantee performance.