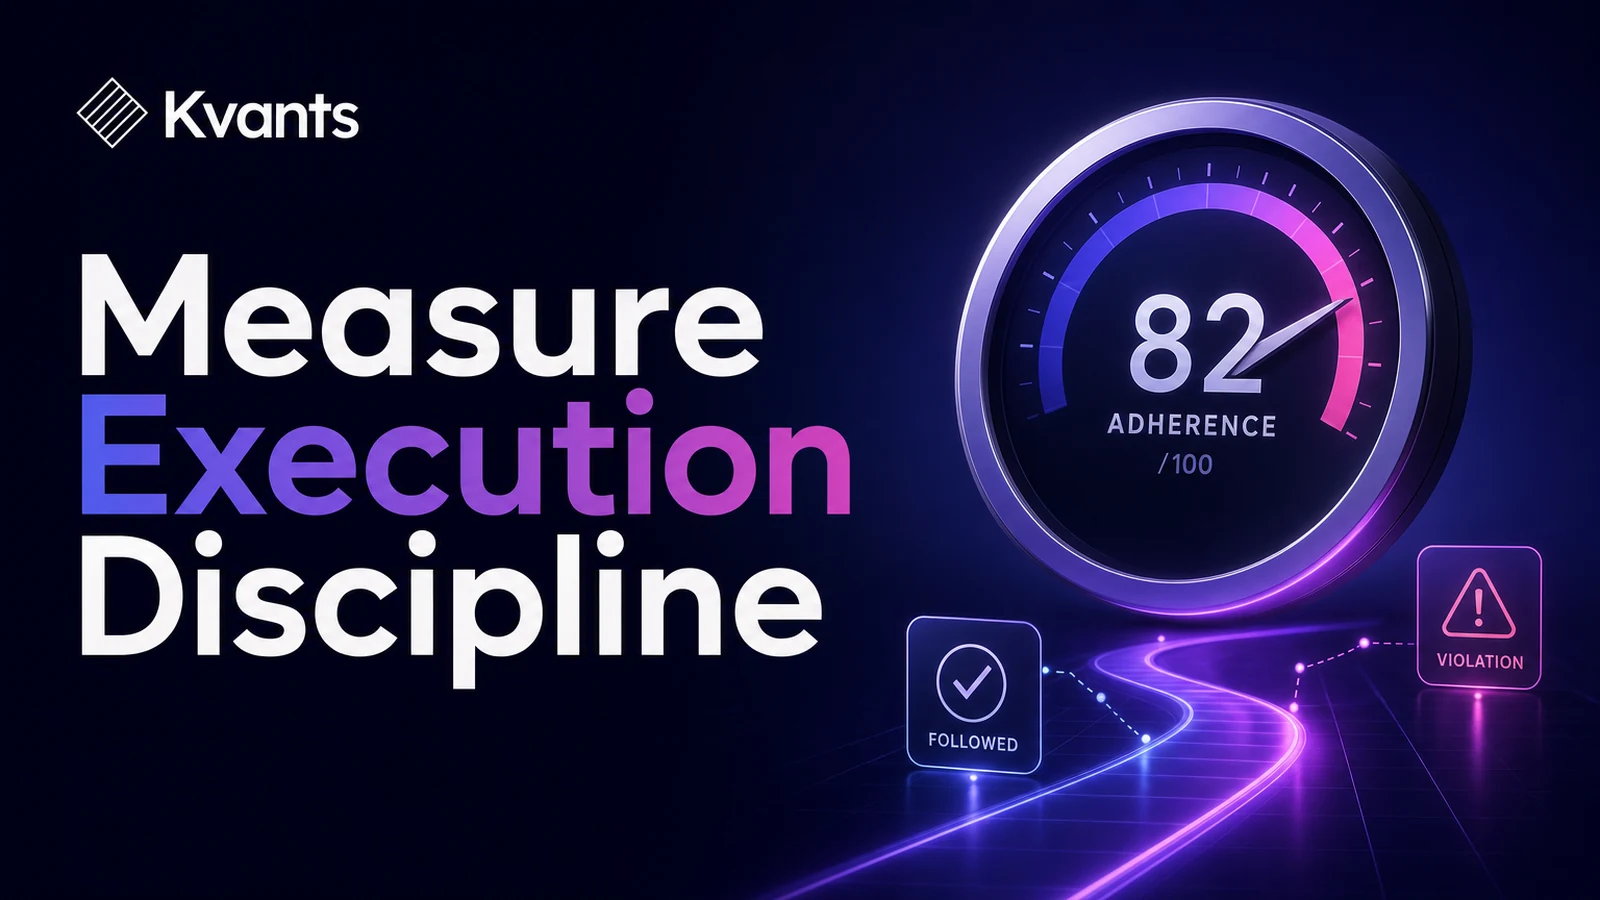
Learn how to define measurable trading rules, calculate an adherence score, find recurring violations, and separate execution quality from trade outcomes.
Quick Answer
Trading rule adherence measures whether you followed your predefined setup, entry, risk, management, and exit rules, regardless of whether the trade won or lost. Convert each important rule into an auditable question, score every applicable check, and review compliance by rule rather than relying only on one average score. The main limitation is that adherence is meaningful only when the underlying rules are specific. Perfectly following a vague or untested plan does not establish that the strategy has an edge.
Key Takeaways
- Evaluate the decision process separately from profit and loss.
- Rewrite vague instructions as binary checks or measurable tolerances.
- Report critical risk breaches separately from minor process errors.
- Analyze compliance by individual rule, setup, session, and trade sequence.
- Keep winning rule violations in the record so favorable outcomes do not hide poor execution.
- Test objective rule changes before adding them permanently to the plan.
What Trading Rule Adherence Measures
Trading rule adherence is the percentage of applicable plan requirements followed during a trade or session.
The basic formula is:
Rule adherence = rules followed ÷ applicable rules × 100
If eight rules applied to a trade and seven were followed, the adherence score was 87.5%.
This is a process metric, not a performance metric. A fully compliant trade can lose because losses are part of a strategy’s outcome distribution. A rule-breaking trade can win because markets sometimes reward poor decisions.
That creates four useful review categories:
- Compliant winner: The process was followed and the outcome was positive.
- Compliant loser: The process was followed and the outcome was negative.
- Non-compliant winner: A rule violation produced a favorable outcome.
- Non-compliant loser: The process and outcome were both unfavorable.
Non-compliant winners deserve special attention. They can reinforce chasing, oversizing, late entries, stop widening, or unplanned exits. If execution quality is judged by P&L alone, a trader may interpret luck as permission to repeat the violation.
Adherence data answers one narrow but important question: Did I execute the plan I intended to trade? It does not establish whether the plan itself is valid.
A Step-by-Step Trading Rule Adherence Workflow
1. Inventory the rules that exist before entry
Start with the plan that was active when the trade occurred. Do not reconstruct an ideal plan after seeing the result.
Group the rules into these categories:
- Setup: Required market, trend, volatility, pattern, indicator, session, or catalyst conditions.
- Entry: Trigger, confirmation, order type, acceptable price range, and invalidation point.
- Risk: Position size, initial stop, maximum account risk, and total exposure.
- Management: Scaling, trailing, break-even, and time-based instructions.
- Exit: Target, invalidation, close condition, or other permitted exit logic.
Track session-level controls separately. A daily loss limit or maximum trade count applies to the session rather than one isolated position.
2. Convert each rule into an auditable check
“Only take strong setups” cannot be scored consistently. A check such as “Did price close above the previous 20-bar high before entry?” can be verified from the chart and order record.
Likewise, replace “avoid excessive risk” with a defined maximum planned loss based on the account value used for risk calculations.
Use one of three answer types:
- Yes or no: Was the required condition present?
- Numeric tolerance: Was the actual value inside the permitted range?
- Not applicable: Did the rule apply to this trade?
Do not treat a non-applicable rule as a pass. Doing so inflates the score.
Some discretionary criteria cannot be made fully binary. In that case, create an anchored rubric. A setup-quality scale should define the evidence required for each grade. Screenshots and notes recorded near the time of execution make later scoring more reliable.
3. Separate critical and non-critical rules
A simple percentage assumes every rule is equally important. Missing a screenshot is not equivalent to exceeding maximum risk.
Mark any rule whose violation invalidates the trade or breaches a risk control as critical. Examples include:
- entering without the required setup;
- exceeding permitted position risk;
- widening a protective stop outside the plan;
- trading after a daily loss threshold has been reached;
- opening exposure in a prohibited market or session.
Report three views together:
- Overall adherence percentage.
- Number of critical violations.
- Compliance rate for each individual rule.
This prevents a serious breach from disappearing inside a high average. Following nine administrative checks does not compensate for violating the sole position-risk limit.
4. Score execution before interpreting the outcome
Review the chart, orders, timestamps, and contemporaneous notes. Grade each rule before studying aggregate P&L when practical. This reduces the temptation to excuse a violation because the trade won or invent a mistake because a valid trade lost.
Record specific evidence for every failed check. “Planned risk was 1R, but actual initial risk was 1.4R” is more useful than “position too large.”
5. Aggregate the results at multiple levels
Calculate adherence by:
- individual rule;
- setup or strategy;
- time of day;
- day of week;
- winning and losing trades;
- trade number within the session;
- trades taken after a loss or unusually large win.
The purpose is to locate repeatable failure points. An 85% overall score may conceal perfect setup selection but frequent exit-rule violations. Rule-level analysis shows where an intervention is actually needed.
Kvants audits that the engine runs the strategy you configured.
Worked Example: From Score to Diagnosis
Assume a trader reviews 20 trades against five rules that applied to every trade:
| Rule | Checks passed | Compliance rate |
|---|---|---|
| Valid setup present | 19 of 20 | 95% |
| Entry trigger confirmed | 16 of 20 | 80% |
| Position risk within limit | 20 of 20 | 100% |
| Stop changed only when permitted | 17 of 20 | 85% |
| Exit followed written logic | 14 of 20 | 70% |
Across 100 applicable checks, 86 were passed. Overall trading rule adherence was therefore 86%.
The average is useful, but the rule-level view provides the diagnosis: exits were the largest process weakness. The trader should inspect those six violations instead of trying to change every part of the plan.
Suppose four violations involved taking gains before a valid exit signal, while two involved staying in after invalidation. Those behaviors should receive separate labels. One may reflect discomfort with open gains; the other may reflect reluctance to accept a planned loss.
A focused intervention could require the trader to record the exact rule authorizing every exit. That change can be evaluated over the next review block without simultaneously altering entries, stops, and position size.
The objective is not to force the score toward 100% at any cost. It is to determine whether the plan can be executed consistently and why repeated deviations occur.
How to Interpret Adherence and Performance Together
After scoring execution, compare fully compliant trades, all non-compliant trades, and trades containing each specific violation.
Relevant metrics may include:
- average R-multiple;
- expectancy;
- maximum drawdown;
- adverse and favorable excursion;
- holding time;
- transaction costs;
- entry slippage.
These comparisons can generate useful hypotheses. Late entries may coincide with worse prices and greater adverse movement. Unplanned early exits may reduce some losses while also truncating larger favorable moves.
However, journal comparisons are observational. They do not automatically prove that a violation caused the outcome. Rule-breaking trades may cluster during unusual volatility, weak liquidity, or unfamiliar market conditions. Reviews can also be affected by hindsight if losing trades are graded more harshly.
Small samples create another limitation. A handful of favorable non-compliant trades is not enough to justify rewriting the plan. Preserve the existing rule while collecting more evidence, or test the proposed alternative separately.
A backtest's equity curve and trade-by-trade log.
Common Measurement Failure Modes
Scoring rules that were never defined precisely
If two careful reviews could reach different answers, tighten the rule or rubric. Ambiguous scoring creates the appearance of measurement without reliable data.
Changing the checklist after seeing the result
This turns review into hindsight. Version the trading plan and record when each revision became active. Apply new rules prospectively unless there is a clearly documented research reason to reclassify historical trades.
Optimizing for a perfect score
A 100% score does not prove that the strategy is sound. It may indicate consistent execution, rules that are too easy to satisfy, or a checklist padded with low-value tasks.
Treating every violation equally
Track critical risk breaches separately. A weighted score can be useful, but transparent rule-level reporting is usually easier to interpret than a complicated formula.
Excluding rule-breaking winners
Keep every executed trade in the complete record. Removing favorable violations distorts the dataset and hides behavior that may be reinforced by short-term outcomes.
Adding restrictions without testing them
A new filter may remove weak trades while also excluding valid opportunities. Before adopting a time filter, confirmation requirement, stop method, or trade cap, evaluate how it changes trade frequency, costs, drawdown, and results across relevant periods.
Trying to correct everything at once
Choose the most important recurring violation and apply one defined process change during the next review block. Multiple simultaneous interventions make it difficult to identify which change affected execution.
Turning Findings Into Testable Strategy Logic
Some adherence problems are primarily behavioral. Others reveal that the plan is difficult to interpret because its instructions are subjective or incomplete.
When a recurring problem involves an objective market condition, convert it into explicit logic. “Avoid late breakout entries,” for example, could become one of the following:
- enter no more than a defined number of bars after confirmation;
- reject entries beyond a maximum distance from the trigger price;
- use a volatility-adjusted entry boundary;
- cancel the setup after a defined invalidation event.
Treat each version as a hypothesis. Test its effects rather than adopting it because it sounds sensible. Include realistic fees, slippage, order behavior, and enough historical variation to expose the rule to different conditions. Reserve out-of-sample data where practical.
Kvants Studio turns plain-English trading ideas into editable, auditable strategy logic. Its event-driven backtesting, parameter sweeps, walk-forward analysis, and crisis-stress validation can help traders research objective rule changes before moving them into paper or controlled live workflows. The Kvants documentation explains the strategy creation and testing process.
Software has an important boundary here. It can evaluate defined market, risk, and execution logic, but it cannot determine whether a discretionary trader honestly followed a subjective rule. Hesitation, attention, emotional state, and off-platform decisions still require accurate records and careful review.
A strategy laid out end to end in the Kvants editor.
Frequently Asked Questions
What is a good trading rule adherence score?
There is no universal target. The meaning depends on rule difficulty, scoring consistency, and violation severity. Prioritize eliminating critical risk breaches, then improve the weakest recurring rule. A high average should never excuse violations of account or strategy risk limits.
Should winning trades with rule violations be excluded?
No. Keep them in the full record and label the violation. You can analyze a separate compliant subset, but preserve the complete dataset so that favorable outcomes do not conceal poor execution.
How often should I review trading plan compliance?
Score trades while the context remains clear, ideally with access to contemporaneous notes and order records. Aggregate the data on a schedule appropriate to your trading frequency. Avoid changing rules based on only a few observations.
Can I use a weighted adherence score?
Yes, provided the method is simple and documented. Larger weights may be appropriate for risk controls, but always report critical violations and individual rule compliance alongside the weighted total.
Does weak performance mean my adherence rules are wrong?
Not necessarily. Results can reflect normal variance, changing market conditions, costs, flawed strategy logic, or execution errors. Adherence analysis isolates the execution question. Strategy validity requires separate historical, out-of-sample, and forward evaluation.
Risk Note
This article is educational and is not investment advice. Trading involves risk, and disciplined execution cannot eliminate losses. Backtested performance does not guarantee future results. Kvants is a research tool, not an investment adviser; validate assumptions and use risk limits appropriate to your circumstances.