Turn the rising and falling three methods candlestick pattern into objective rules, then test its trend filters, entries, exits, costs, and failure modes.
Quick Answer
The three methods candlestick pattern is a five-candle continuation formation: a strong trend candle, three smaller counter-trend candles, and a final candle that resumes the original direction. Rising three methods is bullish; falling three methods is bearish.
Do not trade the visual shape alone. Define the trend, relative candle sizes, containment rule, confirmation close, entry timing, stop, and costs before testing it. Its main limitation is subjectivity: small changes in what counts as a “large,” “small,” or contained candle can materially change the sample and results.
Key Takeaways
- Treat the pattern as a hypothesis, not proof that a trend will continue.
- Use numerical thresholds for candle size and containment.
- Enter no earlier than the confirmation candle’s close; a next-bar entry is easier to simulate honestly.
- Test bullish and bearish versions separately because market behavior may be asymmetric.
- Include spread, commissions, slippage, and gaps in the backtest.
- Validate promising rules on unseen data and across different market conditions.
What the Pattern Is Supposed to Represent
A three methods formation describes an impulse, a controlled pullback, and renewed movement in the original direction.
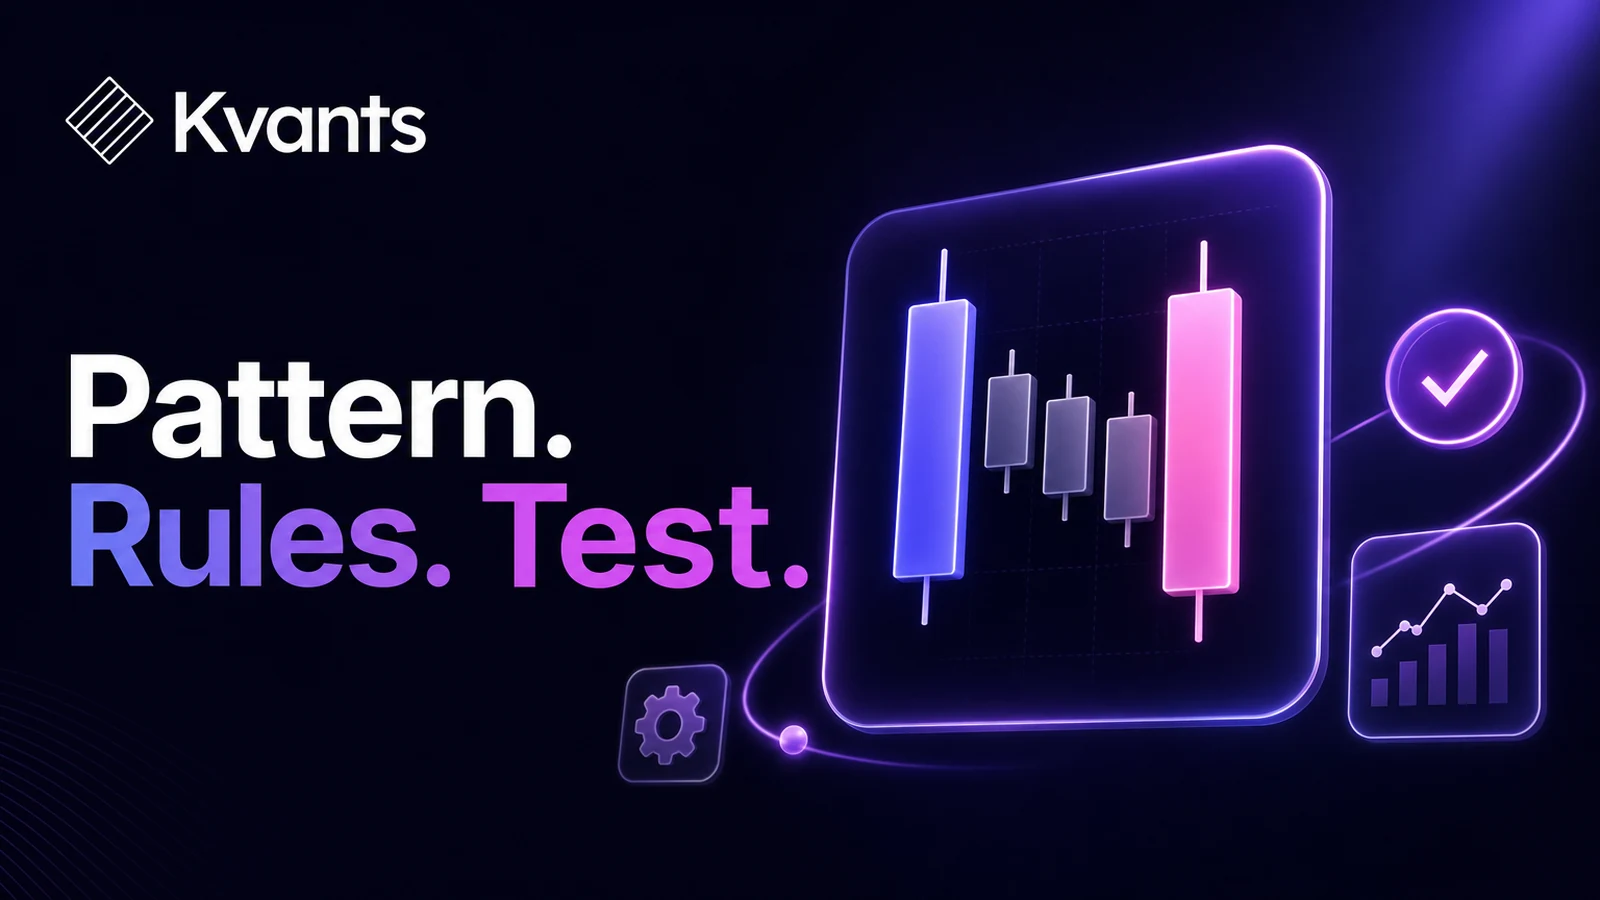
A strict rising three methods formation contains:
- A relatively large bullish candle in an existing uptrend.
- Three smaller candles that move against or pause the trend.
- Middle candles that remain within the first candle’s range.
- A final bullish candle that closes above the first candle’s high.
The falling three methods version reverses those conditions: a large bearish candle appears in a downtrend, three smaller candles pause or retrace upward, and a final bearish candle closes below the first candle’s low.
The story sounds intuitive, but intuition does not establish an edge. The useful research question is narrower: when a precisely defined formation occurs, do subsequent returns justify the strategy’s risk and trading costs?
Browsing tradeable signals in the research library.
Turn the Three Methods Candlestick Pattern Into Rules
Visual descriptions leave too much room for hindsight. Convert each component into a measurable condition.
1. Define the existing trend
Possible trend rules include:
- Closing price above a rising 50-period moving average for bullish patterns.
- Closing price below a falling 50-period moving average for bearish patterns.
- A sequence of higher swing highs and lows, defined with a fixed pivot length.
- Positive or negative return over a specified lookback.
Choose one definition before testing. Adding multiple filters after seeing weak results increases overfitting risk.
2. Define a large first candle
“Large” needs a reference. For example, require the first candle’s true range to exceed 1.2 times the 20-bar average true range. You could instead compare its real body with the median body over the previous 20 bars.
True range captures gaps and wicks, while real body focuses on the distance between open and close. They are not interchangeable.
3. Define the middle candles
A strict rule might require exactly three middle candles, each with a real body no larger than 50% of the first candle’s body. For rising patterns, at least two could close lower than they opened; for falling patterns, at least two could close higher.
Decide whether containment applies to the full high-low range or only to closing prices. Full-range containment is stricter and will usually produce fewer signals.
4. Define confirmation
For a rising pattern, require the fifth candle to close above the first candle’s high. For a falling pattern, require it to close below the first candle’s low.
Using an intrabar break instead creates a different strategy. If the rule depends on a closing price, the signal is not known until that bar closes.
5. Specify entry and invalidation
Common entries include the next bar’s open or a stop order beyond the confirmation candle. Possible invalidation levels include the opposite side of the complete formation, the first candle’s extreme, or an ATR-based distance.
None is automatically correct. The entry and stop must be tested as part of the complete strategy.
A Step-by-Step Backtesting Workflow
Step 1: Write a frozen baseline
Record the market, timeframe, session, trend rule, five candle conditions, entry, stop, exit, position sizing, and cost assumptions. Freeze this version before looking at performance.
Step 2: Check signals manually
Inspect a small set of detections. Confirm that the code handles equal prices, gaps, doji candles, missing bars, and overlapping patterns as intended. This is a logic audit, not performance validation.
Step 3: Run the chronological test
Process candles in time order. If confirmation requires the fifth candle’s close, do not fill the trade at an earlier price from that candle. Use a realistic next-bar fill or model the specified order type and its execution sequence.
Step 4: Measure more than win rate
Review net expectancy, profit factor, maximum drawdown, trade count, average win and loss, holding period, and exposure. Examine the full distribution of trade outcomes rather than relying on one summary metric.
Also compare the strategy with a simple conditional baseline. For example, measure returns after any strong trend candle, not just those followed by the three-candle pause. This tests whether the complete pattern adds information beyond momentum alone.
Step 5: Test sensitivity
Vary only defensible parameters, such as the first-candle size threshold, containment definition, trend lookback, and exit horizon. A result that disappears after a minor threshold change may be too fragile to use.
Step 6: Validate unseen periods
Reserve data for out-of-sample evaluation or use walk-forward analysis. Segment results by volatility, trend strength, instrument, and bullish versus bearish signals. Do not keep redesigning the pattern against the validation period.
A strategy laid out end to end in the Kvants editor.
Worked Rule Example
Consider this hypothetical daily-chart specification for rising three methods:
- Close is above a rising 50-day moving average.
- Candle one is bullish and its true range is at least 1.2 times the prior 20-day average true range.
- The next three candles each have bodies below 50% of candle one’s body.
- All three high-low ranges remain inside candle one’s high-low range.
- Candle five is bullish and closes above candle one’s high.
- Entry occurs at the next session’s open.
- Initial stop is below the lowest low of the five-candle formation.
- Exit occurs at the stop or after ten bars.
- Risk per trade is fixed as a small percentage of research equity.
Suppose candle one ranges from 98 to 104 and closes at 103. The next three candles remain between 98.50 and 103.70. Candle five closes at 104.30, so confirmation exists at that close. A backtest cannot assume entry at 104 before confirmation was available; it must use the next tradable price under the stated rule.
This example is a test specification, not a recommendation. Its thresholds should be challenged rather than accepted by default.
Common Failure Modes
Loose visual labeling: If a formation is accepted because it “looks close enough,” the research cannot be reproduced. Quantify every subjective term.
Ignoring the trend: The same five candles inside a range may describe noise rather than continuation. Test a no-trend baseline to measure what the filter contributes.
Entering before confirmation: Using the fifth candle’s closing condition while assigning an earlier fill introduces look-ahead bias.
Overly strict rules: Requiring perfect containment and exact candle colors may leave too few observations. A small sample can produce unstable metrics.
Pattern mining: Trying many moving averages, body ratios, exits, and instruments before reporting only the strongest combination creates an optimistic result. Keep a research log and protect unseen data.
Ignoring gaps and costs: A next-bar open can differ substantially from the confirmation close. Stops can also fill beyond their trigger during gaps or fast markets.
Researching the Pattern in Kvants
In Kvants Studio, you can describe the candle sequence, trend filter, entry, and exit in plain English, then inspect and edit the resulting strategy logic. This makes ambiguous definitions visible before they reach the backtest.
Kvants supports stocks and crypto research, parameter sweeps, walk-forward analysis, crisis-stress validation, and event-driven backtesting on NautilusTrader’s engine. A sensible workflow is to build a frozen baseline, audit detected trades, test limited variations, and move promising rules into controlled paper testing. The Kvants documentation explains the strategy and export workflow.
Kvants audits that the engine runs the strategy you configured.
Frequently Asked Questions
Is the three methods pattern bullish or bearish?
It can be either. Rising three methods is a bullish continuation formation, while falling three methods is bearish. Test them separately rather than assuming their results will be symmetrical.
Must there be exactly three middle candles?
The classical definition uses three, producing five candles in total. Some traders allow two or more pause candles, but that creates a different rule set. If you test alternatives, label and evaluate them separately.
Where should the stop loss go?
Possible locations include beyond the full formation, beyond the first candle, or at a volatility-based distance. Wider stops reduce position size for a fixed risk budget but may increase loss distance. Backtest each stop with realistic execution instead of choosing one from appearance alone.
What timeframe works best for three methods patterns?
There is no universal best timeframe. Lower timeframes may create more observations but can be more sensitive to spread, slippage, and market microstructure. Higher timeframes produce fewer signals and can involve larger overnight gaps. The appropriate choice depends on the market, execution constraints, and validated results.
Does confirmation guarantee continuation?
No. Confirmation only means the pattern met its predefined conditions. Price can reverse immediately afterward. Position sizing, invalidation rules, and portfolio-level risk limits remain necessary.
Risk Note
This article is educational and is not investment advice. Candlestick formations can fail, and their historical behavior can change. Backtested performance does not guarantee future results. Kvants is a research tool, not an investment adviser, and never guarantees performance.