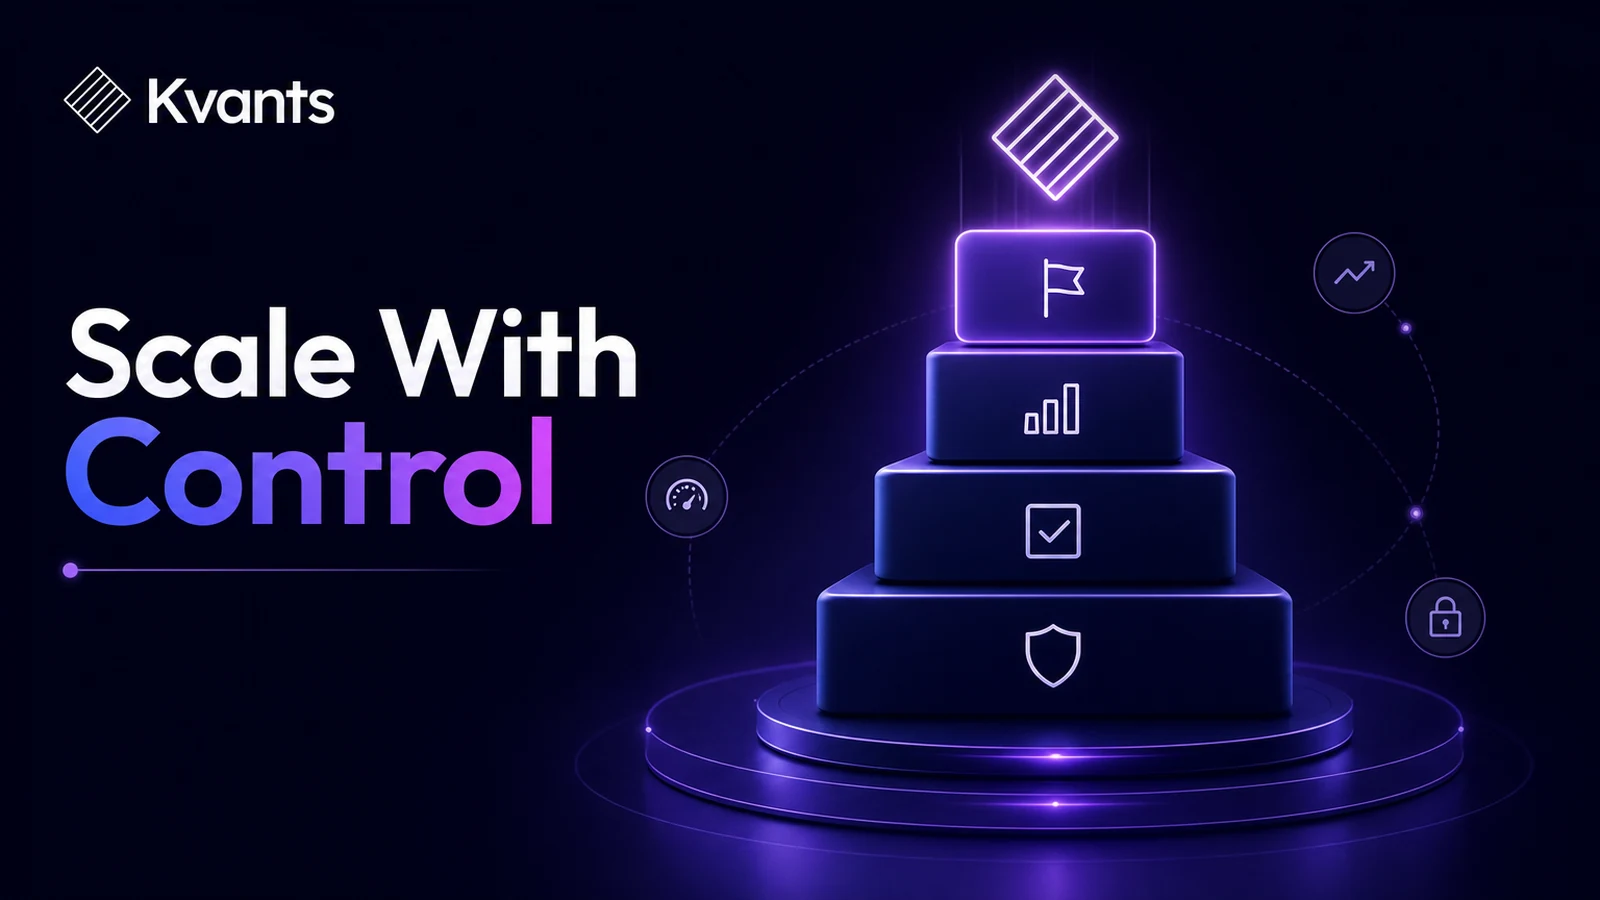
Learn how to increase trading size through readiness gates, incremental risk tiers, execution checks, and rollback rules without relying on a recent winning streak.
Quick Answer
Scaling up trading size should be a controlled experiment, not a reward for recent profits. First confirm that your strategy, execution, and risk process remain stable at the current size. Then increase risk by one predetermined increment while keeping the setup, stop logic, and trading schedule unchanged. Monitor results in R-multiples, execution quality, rule adherence, and drawdown before advancing again. The main limitation is that larger orders can change both your behavior and your fills, so performance at small size may not transfer cleanly.
Key Takeaways
- Increase one sizing variable at a time so you can identify what caused any change in performance.
- Base each trade on a fixed risk budget and valid stop distance, not a desired share or contract count.
- Require process stability before advancing; a short winning streak is not evidence of readiness.
- Define promotion, pause, and rollback rules before trading the larger size.
- Track slippage, partial fills, hesitation, stop changes, and skipped signals alongside profit and loss.
- Treat every new size tier as unproven until it survives enough varied market conditions to evaluate responsibly.
Why Larger Size Changes More Than the P&L
If position size doubles while everything else stays equal, the nominal gain or loss doubles. In practice, however, everything else may not stay equal.
Larger exposure can affect three separate layers of a trading process:
- Financial risk: A normal losing trade, losing streak, or gap produces a larger monetary drawdown.
- Execution: Bigger orders may encounter more slippage, partial fills, wider effective spreads, or difficulty exiting near the intended price.
- Behavior: A trader may hesitate, take profits early, move a stop, skip a valid setup, or watch open P&L instead of market information.
That third layer is easy to dismiss because it is difficult to model. It is still observable. If the same setup is managed differently after size increases, the strategy being traded has effectively changed.
This is why recent profitability is an incomplete promotion criterion. A trader can have a profitable month while breaking rules, benefiting from one favorable market regime, or taking risks that have not yet produced their downside.
Readiness Gates for Scaling Up Trading Size
A readiness gate is a condition that must be satisfied before the next size tier is permitted. The goal is not to prove that future trades will be profitable. It is to establish that the current process is sufficiently controlled to test at a higher level.
The strategy is defined
Entries, invalidation points, exits, allowed markets, trading hours, and risk exceptions should be written clearly enough that individual trades can be classified as compliant or noncompliant.
If the strategy changes from trade to trade, increasing size makes diagnosis harder. You will not know whether a result came from size, a new setup, different market conditions, or discretionary improvisation.
Risk is normalized
Review trades in R-multiples as well as currency. One R is the amount planned to be lost if the initial stop is reached, excluding unexpected gaps or execution differences.
Normalizing results makes small- and large-size trades easier to compare. A $100 loss and a $200 loss are both −1R if each matched its respective risk budget. If losses begin exceeding the intended R after scaling, investigate execution and rule adherence rather than attributing the change to bad luck automatically.
Execution is repeatable
Track whether orders are submitted at the intended time and price, stops are placed correctly, and exits follow the plan. Repeated missed entries, order-entry mistakes, or impulsive overrides at the current size are reasons to delay an increase.
Drawdowns are tolerable in money, not just percentages
A percentage can feel abstract. Convert the planned risk tier into currency and model a plausible run of losses, including costs and adverse fills. Ask whether that amount would affect the next decision.
This is a behavioral constraint as much as a financial one. If the normal loss becomes emotionally unacceptable, the nominal size may exceed the trader's usable risk capacity.
Backtest results with metric tiles and gate coaching.
A Step-by-Step Size Scaling Workflow
1. Freeze the strategy version
Choose the setup and management rules that will be used during the test. Avoid introducing a new entry filter, profit target, and size increase at the same time.
Record the version and start date. This creates a clean boundary for later review.
2. Define the current and proposed risk tiers
Express size as risk per trade rather than a fixed number of shares or contracts. A basic calculation is:
Position size = permitted trade risk ÷ estimated loss per unit at the stop
The estimated loss per unit should include the distance from entry to stop. Fees, spread, slippage, contract multipliers, and lot-size constraints should also be considered where relevant.
3. Choose a single incremental increase
Create a ladder of modest, predetermined tiers rather than jumping directly from comfortable size to a distant target. The appropriate increment depends on capital, instrument liquidity, strategy frequency, and personal tolerance; there is no universal percentage.
A tier should be large enough to test the effect of higher stakes but small enough that a rollback remains manageable.
4. Set promotion criteria
Promotion criteria should combine outcomes and process. Possible requirements include:
- no unresolved risk-rule violations;
- stable execution costs relative to the current tier;
- acceptable drawdown under the written risk budget;
- consistent entry, stop, and exit behavior;
- exposure to more than one market condition;
- no material deterioration in strategy expectancy after costs.
Do not set a promotion rule based only on reaching a profit target. That encourages traders to advance after a favorable streak even when the sample reveals little about execution under stress.
5. Define pause and rollback triggers
Specify what sends the account back to the prior tier. Triggers might include a risk-limit breach, repeated discretionary overrides, materially worse slippage, an order-entry error, or a predefined drawdown threshold.
A rollback is not punishment. It limits the cost of discovering that a tier is not yet operationally stable.
6. Run the new tier without compensating behavior
Take only the setups allowed by the frozen strategy. Do not reduce standards to generate more trades, tighten stops to afford more units, or exit early merely because the open P&L appears larger.
7. Review before advancing again
Compare the new tier with the previous one using R results, costs, adverse and favorable excursion where available, and rule adherence. Separate strategy losses from execution mistakes and behavioral deviations.
Advance only through a scheduled review. Avoid changing size during a session in response to wins, losses, frustration, or confidence.
A strategy laid out end to end in the Kvants editor.
Worked Example: A Three-Tier Scaling Plan
Consider a hypothetical trader whose current risk budget is $100 per trade. Their strategy uses a price-based invalidation point, so the number of units varies with stop distance.
They establish three test tiers:
- Tier 1: $100 planned risk
- Tier 2: $125 planned risk
- Tier 3: $150 planned risk
On a trade with a $0.50 stop distance, before costs and rounding, Tier 1 permits 200 units and Tier 2 permits 250 units. On another trade with a $1 stop, Tier 2 permits only 125 units. The risk tier remains consistent even though the unit count changes.
Before moving to Tier 2, the trader defines a review window and rollback rules. Any stop widening, repeated early exit caused by viewing monetary P&L, or breach of the planned risk budget triggers a return to Tier 1. Slippage is logged separately to determine whether larger orders are affecting fills.
Suppose Tier 2 produces results similar to Tier 1 in R, but the trader repeatedly exits valid positions early because a $125 fluctuation feels uncomfortable. That is not evidence that the underlying setup failed. It indicates that the larger tier changed execution behavior. The appropriate response is to pause or roll back, not to raise the target or search for a more aggressive entry.
The example does not establish that these dollar amounts or increments are suitable for another trader. Its purpose is to show how a size increase can be made measurable and reversible.
Common Scaling Failure Modes
Sizing up after a winning streak
A streak can increase confidence without increasing information about the strategy. If the next tier begins only when recent results are unusually strong, the trader may also be increasing risk near a natural period of mean reversion.
Doubling size in one step
Large jumps make financial and behavioral effects harder to absorb. They also make it difficult to identify the point at which fills or decision quality began to deteriorate.
Tightening the stop to preserve the same cash risk
A stop should represent strategy invalidation. Moving it closer solely to obtain a larger position changes the trade logic and can increase the frequency of stop-outs.
Increasing size during the session
Intraday changes motivated by profit, loss, or emotion replace a stable risk plan with outcome-dependent betting. Size should be determined before the order according to documented rules.
Ignoring liquidity and concentration
A position may fit an account-level risk formula while still being too large relative to available liquidity. Correlated positions can also create more total exposure than each trade appears to carry independently.
Refusing to roll back
Traders sometimes interpret smaller size as failure. That framing encourages them to defend a tier even after execution has deteriorated. A predefined rollback removes some of that negotiation.
Testing a Scaling Rule in Kvants
Once the sizing and rollback rules are explicit, they can be treated as part of the strategy rather than as informal judgment. Kvants Studio turns plain-English trading ideas into editable, auditable strategy logic and runs backtests on NautilusTrader's event-driven engine.
A trader can test multiple risk tiers with parameter sweeps, examine how sizing affects drawdowns and costs, and use walk-forward or crisis-stress validation to check behavior outside one favorable period. Stocks and crypto research are supported. The logic can also be moved through controlled paper and live workflows instead of jumping directly from a historical test to meaningful capital.
The important point is not to optimize for the tier with the highest historical return. It is to determine whether the sizing rule remains within risk constraints across varied conditions and whether assumptions about fills, costs, and exposure are defensible. The Kvants documentation can be used to review the available research workflow and implementation details.
Configuring a backtest in Kvants Studio.
Frequently Asked Questions
How do I know when I am ready to increase trading size?
You are better prepared when your strategy is defined, current-size execution is consistent, risk limits are respected, and the larger monetary loss is tolerable without changing decisions. Profit alone is not sufficient evidence.
How much should I increase my position size?
There is no universal increment. Use a predetermined step that is meaningful enough to test but small enough to reverse. Consider account risk, stop distance, liquidity, costs, strategy frequency, and your response to monetary losses.
Should I size up after a profitable month?
Not automatically. Review whether the profit came from compliant trades across representative conditions. A profitable period can coexist with excessive risk, favorable randomness, or rule violations.
Should position size be based on stop distance?
Usually, if the strategy uses a stop as its invalidation point. Dividing the permitted trade risk by estimated loss per unit keeps planned risk more consistent across trades with different volatility and stop distances.
What should make me reduce size again?
Reduce or pause when you breach risk limits, alter trades because of monetary pressure, make repeated execution errors, encounter materially worse fills, or reach a predefined drawdown trigger. The conditions should be written before the higher tier begins.
Risk Note
This article is educational and is not investment advice. Trading involves substantial risk, and losses can exceed planned amounts because of gaps, slippage, liquidity constraints, or operational errors. Backtested performance does not guarantee future results. Kvants is a research tool, not an investment adviser, and does not guarantee performance.