Learn how profit factor is calculated, what it reveals about a trading strategy, and why sample size, costs, outliers, and market regimes determine whether it is trustworthy.
Quick Answer
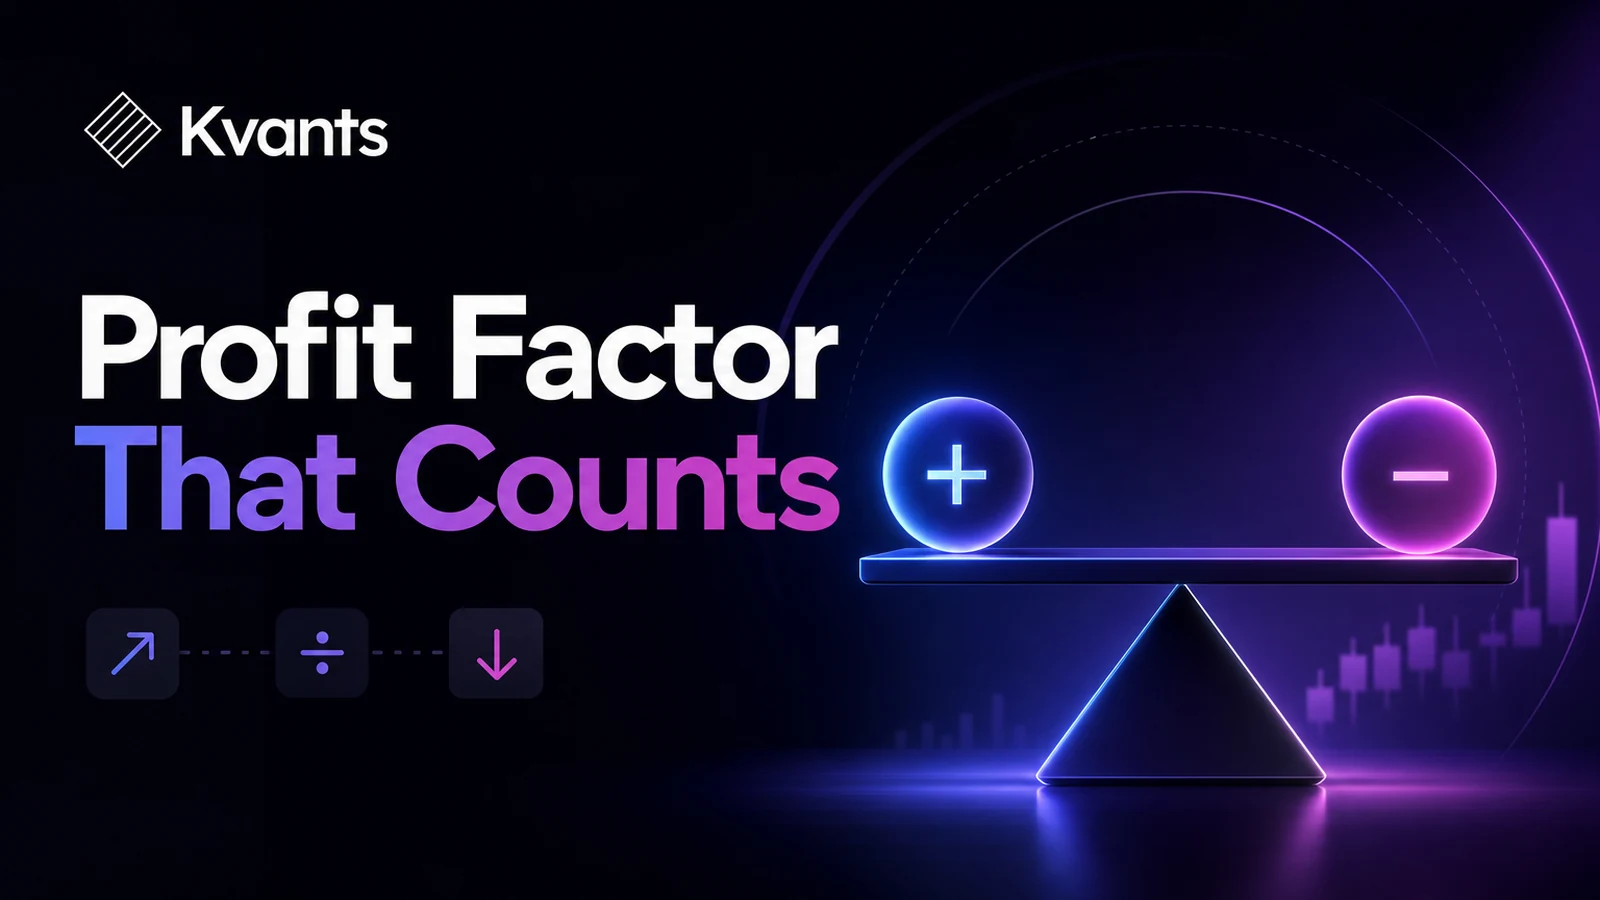
Profit factor in trading is the ratio of a strategy’s gross winning trades to its gross losing trades. Divide total profits from winning trades by the absolute value of total losses from losing trades. A result above 1 means historical gross profits exceeded historical gross losses; below 1 means the opposite.
Profit factor is useful, but it cannot establish that a strategy is robust or likely to remain profitable. Its meaning depends on sample size, trading costs, outliers, market conditions, and how the test was constructed.
Key Takeaways
- Profit factor equals gross profit divided by absolute gross loss.
- A value above 1 indicates a positive historical result, not a guaranteed future edge.
- The metric should be calculated after realistic commissions, fees, spread, slippage, and funding costs where applicable.
- A few unusually large winners can make profit factor look stronger than the typical trade.
- Evaluate profit factor alongside trade count, expectancy, drawdown, win rate, payoff ratio, and regime stability.
- Prefer a moderate result that survives out-of-sample testing over an exceptional result produced by overfitting.
What Profit Factor in Trading Measures
Profit factor measures how much a strategy gained on winning trades for each unit it lost on losing trades during a defined period.
The formula is:
Profit factor = Gross profit ÷ |Gross loss|
Gross profit is the sum of all positive trade outcomes. Gross loss is the sum of all negative trade outcomes, expressed as an absolute value in the calculation.
The basic interpretation is straightforward:
- Profit factor above 1: Gross winning trades exceeded gross losing trades.
- Profit factor equal to 1: Gross wins and losses were equal.
- Profit factor below 1: Gross losses exceeded gross wins.
Suppose a strategy generated $8,000 from its winners and lost $5,000 across its losers. Its profit factor would be:
$8,000 ÷ $5,000 = 1.60
That means the strategy produced $1.60 in gross profit for every $1.00 of gross loss in that sample.
Profit factor is not the same as return. Two strategies can have the same profit factor but produce very different returns because they use different position sizes, trade frequencies, holding periods, or amounts of capital.
It is also not a risk measure. The formula says nothing directly about maximum drawdown, loss concentration, leverage, or the time required to recover from a decline.
A Worked Profit Factor Example
Consider ten trades recorded in risk units, or R. One R represents the amount initially risked on a trade.
| Trade | Result |
|---|---|
| 1 | +2.0R |
| 2 | +1.5R |
| 3 | -1.0R |
| 4 | -1.0R |
| 5 | +3.0R |
| 6 | -1.0R |
| 7 | +0.5R |
| 8 | -1.0R |
| 9 | -1.0R |
| 10 | +2.0R |
Gross profit is the sum of the five winners:
2.0R + 1.5R + 3.0R + 0.5R + 2.0R = 9.0R
Gross loss is the absolute sum of the five losses:
|-1.0R - 1.0R - 1.0R - 1.0R - 1.0R| = 5.0R
The profit factor is:
9.0R ÷ 5.0R = 1.80
Net performance is +4R, and the win rate is 50%. Average expectancy is +0.4R per trade.
These figures describe the same sample from different angles. Profit factor shows the relationship between total gains and losses. Win rate shows how frequently trades won. Expectancy estimates the average outcome per trade. None should be treated as a complete verdict alone.
Costs must also be included. Recalculate every trade after commissions, spread, slippage, funding, and other applicable costs, then rebuild gross profit and gross loss from those net outcomes. Do not assume that subtracting total costs only from gross profit produces an accurate cost-adjusted profit factor; costs can turn small winners into losses and change both sides of the ratio.
What Counts as a Good Profit Factor?
There is no universal profit factor that makes a strategy “good.” The same value can carry different levels of credibility depending on how it was produced.
A profit factor slightly above 1 may disappear after a modest increase in costs. A very high profit factor may come from a small sample, one outlier, or parameters selected after examining the full dataset. A lower result across many trades, instruments, and market regimes may be more dependable than a spectacular result from one favorable period.
Interpret the number by asking:
- How many trades produced it? Ten trades provide far less evidence than hundreds of independent opportunities.
- Does it include realistic costs? High-turnover strategies are particularly sensitive to execution assumptions.
- Is it concentrated? Remove the largest winner and recalculate. A sharp collapse reveals outlier dependence.
- Is it stable through time? Calculate it by month, quarter, year, or market regime rather than only for the full sample.
- Was the same data used to design and judge the rules? In-sample results are more vulnerable to overfitting.
- What risk produced the result? Profit factor does not reveal drawdown, leverage, or exposure by itself.
The practical goal is not to maximize profit factor at any cost. It is to determine whether the apparent edge remains positive under assumptions that more closely resemble actual trading.
Deploying a strategy to paper or live with a pre-flight gate.
A Step-by-Step Evaluation Workflow
1. Define the measurement scope
Specify the strategy version, instruments, timeframe, test dates, position-sizing method, and cost model. Changing any of these can change the result.
Avoid combining unrelated strategies into one profit factor unless your question concerns the combined portfolio. Aggregation can conceal a weak component behind a stronger one.
2. Calculate trade outcomes consistently
Use currency, percentage returns, or R-multiples consistently. R-multiples are useful for comparing trades with different position sizes, while currency results describe the actual account impact.
Make sure partial exits, scaling, and fees are handled consistently. Decide whether a trade is one complete position lifecycle or several separate executions before calculating the metric.
3. Apply realistic trading costs
Include the costs relevant to the market and holding period. A limit-order fill should not be assumed merely because price touched the order level. Likewise, a backtest should not rely on fills that would have been unavailable with the information known at that moment.
Test more conservative cost assumptions as well as the base case. If a small increase in slippage moves profit factor below 1, the strategy has little operational margin.
4. Check complementary metrics
Review profit factor with:
- Total trade count
- Win rate
- Average winner and average loser
- Expectancy per trade
- Maximum drawdown
- Recovery time
- Exposure and turnover
- Longest losing streak
This combination helps distinguish a broad, repeatable pattern from a result dominated by a few trades or excessive risk.
5. Segment the result
Calculate profit factor by instrument, direction, setup, volatility condition, and time period. Segmentation can reveal that an apparently successful strategy only worked in one market environment.
Keep the number of segments reasonable. Searching through many categories and retaining only the best is another form of overfitting.
6. Test robustness outside the development sample
Reserve unseen data for validation. Walk-forward analysis can repeatedly develop rules on earlier data and evaluate them on later periods. Parameter sweeps can show whether nearby settings behave similarly or whether performance exists only at one narrow value.
Crisis-stress testing can also reveal how the rules behave during unusually volatile or disrupted markets. The objective is not to prove that every future event is covered. It is to expose fragility before capital is committed.
7. Define a decision rule before reviewing results
State what would invalidate the strategy in advance. Examples include profit factor falling below 1 after costs, excessive dependence on one instrument, or unacceptable drawdown under stress assumptions.
Predefined standards reduce the temptation to explain away an unfavorable result after seeing it.
Configuring a backtest in Kvants Studio.
Common Profit Factor Failure Modes
Ignoring sample size
Profit factor can look impressive after a short winning run. A limited sample may not contain enough losses, changing regimes, or adverse execution to represent the strategy fairly.
Optimizing for the highest value
Selecting the parameters with the highest historical profit factor often selects noise. Look for stable regions where neighboring parameter combinations remain viable, not a single isolated peak.
Letting one winner dominate
A strategy may appear robust because one trade accounts for much of its gross profit. Recalculate after removing the largest winner and inspect the distribution of outcomes.
This does not mean large winners are invalid. It means the strategy’s dependence on rare outcomes should be understood.
Mixing pre-cost and post-cost results
A pre-cost profit factor cannot answer whether a strategy was economically viable to execute. Costs should be applied at the trade level before the ratio is calculated.
Hiding regime dependence
A full-period figure may average together a strong trending period and a weak range-bound period. Time and regime breakdowns show when the strategy historically did and did not function.
Treating the metric as a forecast
Profit factor summarizes recorded or simulated trades. It does not specify the probability of future profits, and a live result can differ because of market changes, execution, data quality, or trader behavior.
Using Kvants to Investigate Profit Factor
A reliable profit-factor review starts with explicit strategy rules. Kvants Studio turns plain-English trading ideas into editable, auditable logic and runs backtests on NautilusTrader’s event-driven engine.
Rather than stopping at one backtest, traders can use parameter sweeps, walk-forward analysis, and crisis-stress validation to investigate whether profit factor persists across settings and periods. The relevant question is not simply, “What is the highest value?” It is, “Where does the result remain positive without relying on implausible assumptions or one narrow configuration?”
Kvants also supports Pine Script v6 export and controlled paper or live workflows, allowing the rules to be checked across research stages. The Kvants documentation explains the strategy-building and validation workflow, while the Kvants blog covers related research concepts.
Kvants is a research tool, not a substitute for judgment. Users remain responsible for the strategy specification, data choices, execution assumptions, and risk limits.
A strategy laid out end to end in the Kvants editor.
Frequently Asked Questions
Can profit factor be negative?
No. Gross profit and the absolute value of gross loss are non-negative, so the ratio cannot be negative. A strategy with losses greater than gains has a profit factor between 0 and 1.
What if there are no losing trades?
The denominator is zero, so profit factor is undefined or effectively infinite. This usually indicates an insufficient sample rather than proof of a riskless strategy. Expand the test and examine whether open losses, costs, or unrealistic fills were omitted.
Is profit factor better than win rate?
Neither is universally better. Win rate measures winning frequency, while profit factor includes the size of gains and losses. A high win rate can coexist with poor results if occasional losses are large. Use both with expectancy and drawdown.
How many trades are needed for a reliable profit factor?
There is no fixed number that makes the metric reliable. The required sample depends on trade frequency, outcome variability, market coverage, and dependence between trades. More observations help, but market diversity and out-of-sample evidence also matter.
Should profit factor be calculated in dollars or R-multiples?
Both can be useful. Dollars show actual account impact, while R-multiples normalize outcomes by planned risk. If position size changes substantially, compare both to identify whether results came from the strategy or from changes in exposure.
Why did live profit factor differ from the backtest?
Possible causes include slippage, spread, commissions, delayed signals, missed fills, changing liquidity, rule deviations, data differences, and market-regime change. Compare live trades with simulated trades individually before altering the strategy.
Risk Note
This article is educational and is not investment advice. Trading involves risk, including the possible loss of capital. Profit factor is a historical summary rather than a promise of future profitability. Backtested performance does not guarantee future results, and simulated execution may differ materially from live trading.