Learn how to calculate maximum drawdown from an equity curve, measure recovery time, avoid misleading results, and turn historical drawdowns into practical risk controls.
Quick Answer
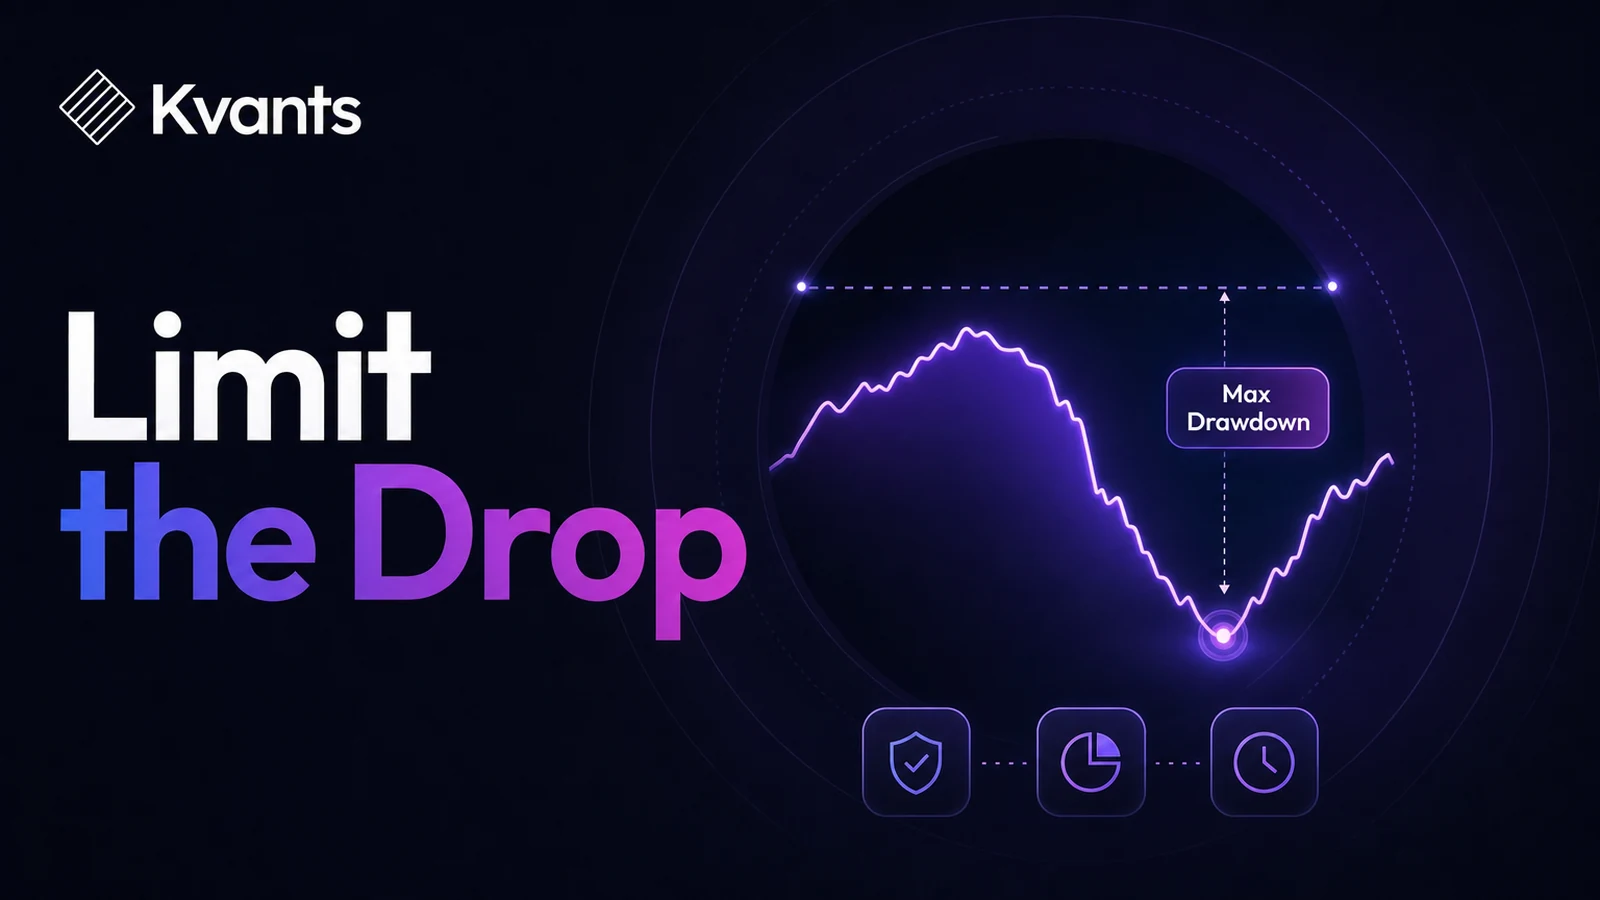
Maximum drawdown in trading is the largest decline from an equity peak to a subsequent trough before a new peak is reached. Calculate it by tracking the running peak of an equity curve, measuring each decline from that peak, and selecting the deepest decline. Use both percentage depth and duration when evaluating risk. The main limitation is that maximum drawdown is sample-dependent: a backtest’s worst historical decline is not a guaranteed ceiling for future losses.
Key Takeaways
- Maximum drawdown measures the worst peak-to-trough equity decline, not simply the largest losing trade.
- Percentage drawdown should be calculated relative to the preceding equity peak.
- Mark-to-market equity usually reveals more risk than closed-trade balances alone.
- Drawdown duration and recovery time can matter as much as the percentage loss.
- Historical maximum drawdown should inform risk limits, not become the limit itself.
- Strategy rules, position size, costs, and order execution must remain consistent when comparing results.
What Maximum Drawdown Actually Measures
A drawdown begins when an equity curve falls below its previous high. It ends when equity reaches a new high. During that period, the deepest point is the trough.
Maximum drawdown is the largest such peak-to-trough decline in the period being analyzed. In percentage terms:
Drawdown = (Current equity − Running peak equity) ÷ Running peak equity
Because current equity is below the peak during a drawdown, the result is negative. Some reports display its absolute magnitude instead. For example, a result of −12% may be shown as a 12% drawdown.
For every point t in the equity series:
- Find the highest equity recorded up to t.
- Compare current equity with that running peak.
- Calculate the percentage decline.
- Select the most negative result.
This metric describes the path of returns. Two strategies can finish with the same net result while exposing traders to very different declines along the way.
Maximum drawdown should not be confused with:
- Largest loss: the worst result from one trade.
- Losing streak: a sequence of losing trades, regardless of equity peaks.
- Current drawdown: the decline from the latest peak at the present time.
- Average drawdown: the average depth of multiple drawdown episodes.
How to Calculate Maximum Drawdown in Trading
Step 1: Define the equity series
Decide what each equity observation represents. For a realistic risk assessment, use mark-to-market equity that includes open-position gains and losses. A closed-trade balance can hide severe adverse movement inside trades.
Also choose a consistent observation frequency. Daily snapshots may be sufficient for slower strategies, but intraday systems can experience material losses between daily observations. Their equity should be sampled frequently enough to capture the risk created by open positions.
Step 2: Adjust for deposits and withdrawals
External cash flows can create false peaks or recoveries. If capital is added to the account, the increase should not be treated as strategy profit. Build a cash-flow-adjusted equity series or calculate strategy returns independently of deposits and withdrawals.
Step 3: Calculate the running peak
At each observation, record the highest equity value reached so far. The running peak stays unchanged while equity remains below it and updates only when a new high occurs.
Step 4: Calculate every drawdown
Subtract the running peak from current equity, then divide by the running peak. Record both the percentage and monetary decline when possible.
Percentage values make different account sizes easier to compare. Monetary values remain useful for understanding the actual capital exposure.
Step 5: Identify depth, duration, and recovery
Select the deepest decline as maximum drawdown, but retain the entire episode:
- Peak date
- Trough date
- Recovery date, if recovery occurred
- Peak-to-trough duration
- Total time spent below the prior peak
An unrecovered drawdown should remain marked as open. Do not assign it an artificial recovery date at the end of a backtest.
Worked Maximum Drawdown Example
Consider this simplified end-of-day equity series:
| Day | Equity | Running Peak | Drawdown |
|---|---|---|---|
| 1 | $100,000 | $100,000 | 0.00% |
| 2 | $104,000 | $104,000 | 0.00% |
| 3 | $101,000 | $104,000 | -2.88% |
| 4 | $97,000 | $104,000 | -6.73% |
| 5 | $99,000 | $104,000 | -4.81% |
| 6 | $95,000 | $104,000 | -8.65% |
| 7 | $102,000 | $104,000 | -1.92% |
| 8 | $105,000 | $105,000 | 0.00% |
The peak is $104,000 and the trough is $95,000. The monetary drawdown is $9,000. The percentage calculation is:
($95,000 − $104,000) ÷ $104,000 = −8.65%
The maximum drawdown is therefore 8.65% when expressed as a positive magnitude. The drawdown begins after Day 2, reaches its trough on Day 6, and recovers on Day 8.
This calculation could still understate risk. If open positions pushed intraday equity down to $92,000 on Day 6 before recovering, the mark-to-market drawdown would have been 11.54%, not 8.65%.
Turning Drawdown Into Practical Risk Limits
There is no universally acceptable maximum drawdown. A tolerable level depends on capital needs, leverage, strategy behavior, holding period, account restrictions, and the trader’s ability to follow the system during losses.
Use drawdown as part of a layered risk process:
- Set a personal or account-level loss budget. Decide what decline would require reduced exposure, a pause, or a full review.
- Estimate strategy drawdown under realistic assumptions. Include fees, slippage, open-position equity, and executable order timing.
- Test multiple position sizes. Drawdown generally rises with exposure, but costs, margin constraints, and nonlinear execution effects mean simple multiplication may be unreliable.
- Examine different market periods. Compare development, out-of-sample, walk-forward, and stressed results rather than relying on one full-period number.
- Create action thresholds. A warning threshold might trigger an execution audit, while a higher threshold could trigger reduced size or suspension pending investigation.
Thresholds should leave room for a future drawdown to exceed the backtested maximum. The observed maximum is one realization from one sequence of market conditions—not a hard boundary.
Also consider recovery arithmetic. A 10% decline requires an 11.1% gain on the reduced capital to recover. A 25% decline requires a 33.3% gain. As drawdown deepens, the return required to regain the prior peak rises faster.
Deploying a strategy to paper or live with a pre-flight gate.
Common Drawdown Measurement Failures
Measuring only closed trades
A strategy can appear stable if losses are recognized only when positions close. Use mark-to-market equity when open risk is material.
Ignoring costs and execution
Optimistic fills or omitted costs can inflate peaks and soften troughs. Drawdown analysis is only as credible as the execution model beneath it.
Treating the backtest maximum as a forecast
The next losing sequence can be worse than anything in the sample. Regime changes, clustered losses, gaps, and liquidity changes can all produce a deeper decline.
Looking only at percentage depth
A shallow drawdown lasting a year may be harder to trade than a somewhat deeper decline that recovers quickly. Track time underwater as well as depth.
Choosing parameters by lowest drawdown
Searching many parameter combinations and selecting the smoothest historical equity curve can overfit the strategy. Prefer regions where results remain reasonably stable across neighboring values and validation periods.
A backtest's equity curve and trade-by-trade log.
Evaluating Drawdown in Kvants Studio
In Kvants Studio, traders can turn plain-English ideas into editable strategy logic and run them through NautilusTrader’s event-driven backtesting engine. That provides a structured way to evaluate how entries, exits, position size, costs, and order sequencing affect the equity path.
A practical workflow is to establish one baseline strategy, then run parameter sweeps across risk settings rather than optimizing solely for return. Compare maximum drawdown, drawdown duration, trade count, and return behavior across the resulting configurations.
Walk-forward analysis can show whether the risk profile persists outside each strategy-development window. Crisis-stress validation can examine behavior during difficult historical conditions. Neither process guarantees a future drawdown limit, but both provide more evidence than a single in-sample result.
Before considering real capital, verify the strategy specification and execution assumptions, then observe it in a controlled paper workflow. The Kvants documentation explains how strategy logic and testing workflows fit together, while the Kvants blog covers broader validation and risk concepts.
Configuring a backtest in Kvants Studio.
Frequently Asked Questions
What is a good maximum drawdown?
There is no universal figure. A suitable limit must reflect the strategy’s leverage, expected variability, recovery behavior, account rules, and the trader’s financial and psychological tolerance. It should also include a margin above the largest drawdown observed in testing.
Should I calculate drawdown from balance or equity?
Use mark-to-market equity for the more complete risk view because it includes unrealized gains and losses. Balance-based drawdown can still be reported, but it may conceal adverse movement within open trades.
Does maximum drawdown include open trades?
It does if the underlying equity series marks open positions to market. If the calculation updates only after trades close, open-trade drawdowns will be excluded. Always check which method a report uses.
Can maximum drawdown be reduced by lowering position size?
Often, but the relationship may not be perfectly linear. Lower exposure can reduce gains and losses, while minimum order sizes, costs, slippage, margin, and overlapping positions can change the result. Rerun the strategy at each proposed size instead of assuming exact proportional scaling.
How much historical data is needed?
Enough to include a meaningful number of trades and varied market conditions. Calendar length alone is not sufficient: a low-frequency strategy may need a longer period than a high-frequency strategy. Out-of-sample, walk-forward, and stressed periods should supplement the main backtest.
Risk Note
This article is educational and is not investment advice. Maximum drawdown is a historical, model-dependent measurement rather than a guaranteed loss limit. Backtested performance does not guarantee future results, and live trading may involve deeper losses because of changing markets, gaps, liquidity, costs, or execution differences.