Learn how leading and lagging indicators differ, when each is useful, and how to combine them in a testable strategy without adding redundant confirmation.
Quick Answer
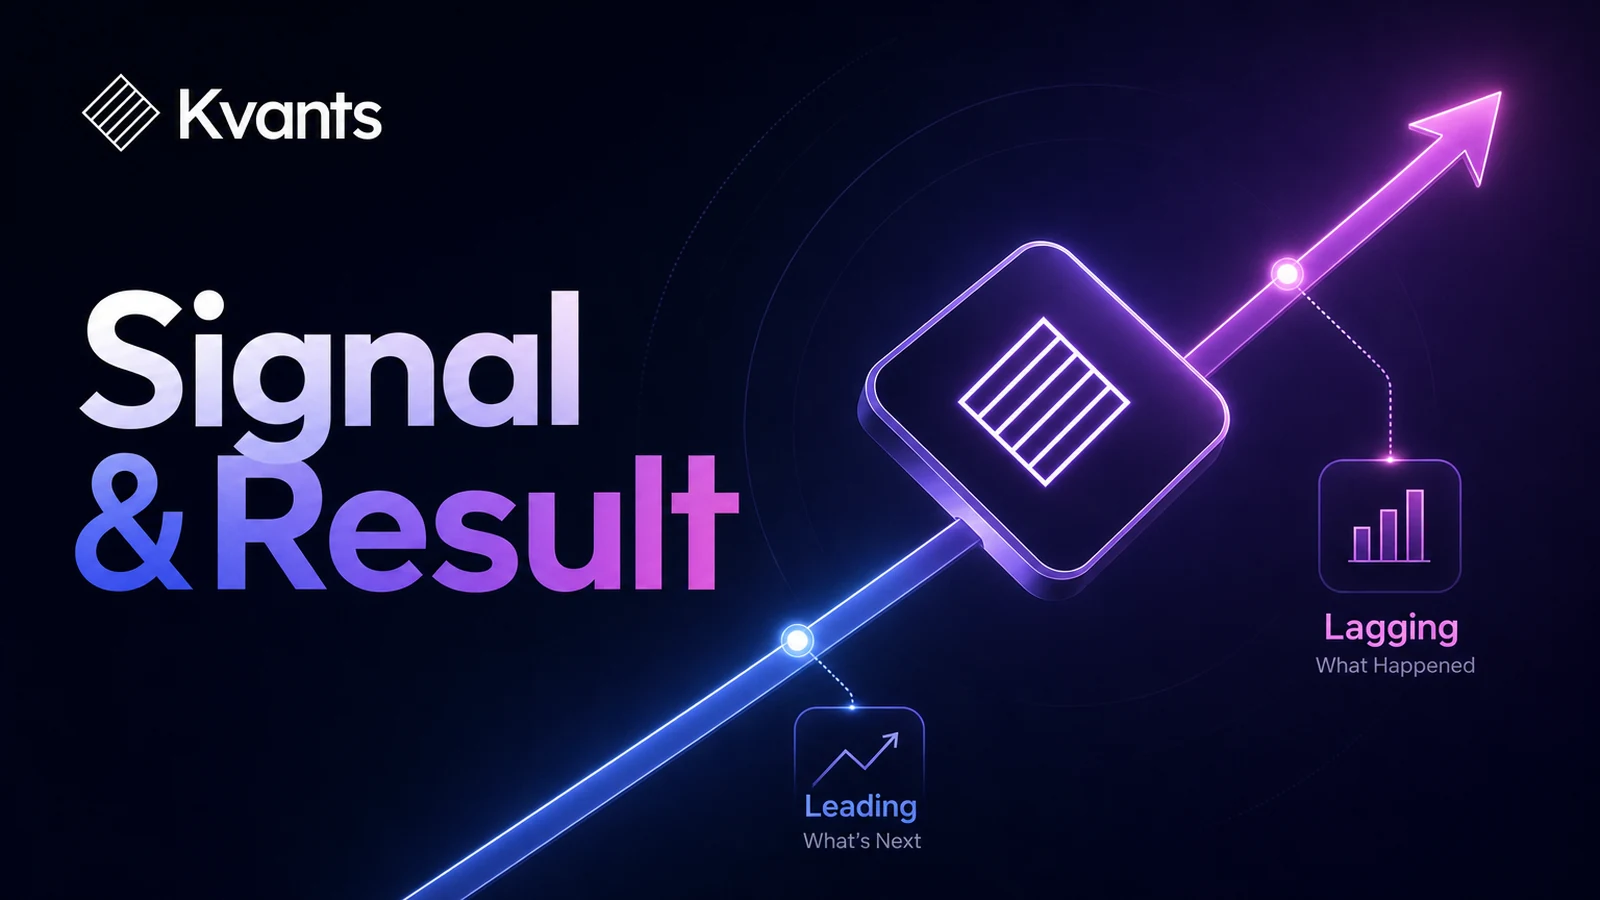
Leading indicators identify a possible change before price provides broad confirmation, while lagging indicators respond after a trend or momentum shift is underway. Neither type is universally better. Earlier signals offer more responsive entries but tend to create more false starts; confirmation can filter some weak setups but necessarily arrives later.
A practical strategy gives each indicator one distinct role, such as regime filter, setup, trigger, or exit. The main limitation is that both types use current or historical data. “Leading” describes relative responsiveness, not an ability to predict the future.
Key Takeaways
- Leading indicators can identify potential turning points early, but extremes may persist during strong trends.
- Lagging indicators confirm observed conditions, so some delay is unavoidable.
- An indicator’s practical role depends on its rule, lookback, timeframe, and decision point.
- Combine complementary measurements rather than several indicators derived from similar price behavior.
- Test the complete strategy against simpler versions to determine whether confirmation adds value.
- Backtesting can reject weak rules, but it cannot prove that an indicator will work in the future.
Leading vs Lagging Indicators at a Glance
The distinction reflects a trade-off between responsiveness and confirmation. A leading indicator attempts to detect a condition early. A lagging indicator waits for more evidence.
| Indicator type | Typical role | Examples | Best For | Main Limitation |
|---|---|---|---|---|
| Leading | Setup or early trigger | RSI, Stochastic Oscillator, Williams %R, divergence | Pullbacks, range rotations, exhaustion, or early momentum changes | More premature signals and false starts |
| Lagging | Regime filter or confirmation | Moving averages, MACD, trend-following crossovers | Confirming direction and filtering countertrend trades | Later entries and exits |
These labels are useful but not rigid. RSI is commonly called leading because traders use extreme readings to anticipate reversals. A rule that waits for RSI to recover above a threshold, however, confirms a change relative to the initial extreme.
Moving averages are considered lagging, but a short moving average responds faster than a long one. Precise rules matter more than the category assigned to an indicator.
A strategy laid out end to end in the Kvants editor.
What Each Indicator Type Actually Measures
Leading indicators generally measure momentum, relative position within a recent range, or divergence. They answer questions such as:
- Has recent selling become unusually strong?
- Is price closing near the edge of its recent range?
- Is momentum weakening while price reaches a new extreme?
An oversold RSI reading does not mean price must rise. It means recent downside movement has pushed the calculation below a selected threshold. That condition may precede a reversal in a range, but it can also describe continuing weakness in a downtrend.
Lagging indicators summarize price behavior that has already occurred. A rising moving average can indicate that the recent price path is upward. A crossover can show that shorter-term prices have strengthened relative to a longer baseline.
Their delay is not a flaw that can be removed for free. Faster settings reduce delay but increase sensitivity to noise. Slower settings provide more smoothing but react later.
Browsing tradeable signals in the research library.
How to Combine Leading and Lagging Indicators
A useful combination assigns a different job to each component. Follow this workflow before optimizing parameters.
Step 1: State the hypothesis
Explain why the setup might exist in one sentence. For example: “Pullbacks in established uptrends may resume after short-term downside momentum begins to recover.”
That hypothesis suggests two separate measurements: an established trend and a recovering pullback.
Step 2: Assign decision roles
Organize the strategy around five roles:
- Regime: Determines whether the market environment is eligible.
- Setup: Identifies a potential opportunity.
- Trigger: Specifies when to enter.
- Invalidation: Defines when the premise is no longer valid.
- Exit: Closes the position according to a predefined rule.
A lagging measure often serves as the regime filter, while a more responsive measure supplies the setup or trigger. This is a common arrangement, not a requirement.
Step 3: Replace subjective terms
Convert “strong trend,” “oversold,” and “clear confirmation” into calculations. Specify the indicator, lookback, threshold, timeframe, and evaluation point.
Also define when the signal becomes known. If a rule uses a completed daily close, entering at that same close may be unrealistic unless the execution model explains how the order could have been placed and filled.
Step 4: Complete the strategy
Add position sizing, stop logic, exposure limits, exits, transaction costs, and order assumptions. Indicator conditions alone do not form a complete trading strategy.
Step 5: Compare simpler variants
Test at least three versions:
- The responsive trigger without the trend filter.
- The trend filter with a simple entry rule.
- The complete combination.
Compare trade count, drawdown, turnover, exposure, costs, and behavior across market periods. A filter that improves a headline metric may merely remove trades or concentrate the outcome in a narrow period.
Worked Example: Trend Filter With a Pullback Trigger
Consider an illustrative daily, long-only stock strategy designed to test pullback continuation:
- Universe: A predefined group of liquid stocks selected without future information.
- Regime: The close is above the 200-day simple moving average, and the average is higher than it was 20 sessions earlier.
- Setup: The 14-day RSI closes below 30.
- Trigger: RSI later closes back above 30 while the regime remains valid.
- Entry: Enter at the next session’s open.
- Stop: Use the setup’s lowest low plus a predefined volatility buffer.
- Sizing: Calculate quantity from entry-to-stop distance, subject to an exposure cap.
- Exit: Close after a maximum holding period, after a defined trend failure, or when the stop executes.
The moving average is a lagging regime filter. RSI provides the more responsive setup and trigger. The rules do not assume an oversold reading guarantees a reversal. They test whether momentum recovery behaves differently inside an established uptrend.
Before running the test, define the volatility buffer, holding period, treatment of gaps, commissions, slippage, universe history, and whether overlapping signals are allowed.
Test a modest range of neighboring RSI thresholds rather than trusting one favorable setting. If the result changes sharply when 30 becomes 28 or 32, the rule may be parameter-sensitive.
Common Failure Modes
Redundant confirmation
RSI, Stochastic, and Williams %R all derive information from recent price behavior. Requiring agreement may count similar evidence several times rather than introduce independent confirmation.
Excessive delay
Every additional confirmation can postpone entry or eliminate trades. Measure the cost of each filter instead of assuming that more conditions make a strategy safer.
Automatic reversal assumptions
Oscillators can remain overbought or oversold during persistent trends. An extreme reading describes recent conditions; it does not command price to reverse.
Look-ahead bias
A signal based on a completed bar cannot be known earlier in that bar. Entering before all required inputs were available makes the historical test unreliable.
Excessive optimization
Searching many indicators, thresholds, exits, and markets increases the chance of finding a historical coincidence. Limit the search space and preserve unseen data for validation.
Testing Indicator Rules in Kvants
Once the rules are explicit, Kvants Studio can turn a plain-English strategy into editable, auditable logic. Review the generated regime, setup, trigger, sizing, and exit conditions before running a test.
Kvants supports stock and crypto research using NautilusTrader’s event-driven backtesting engine. Available research workflows include parameter sweeps, walk-forward analysis, crisis-stress validation, and Pine Script v6 export. Start with the simplest variant, inspect individual trades, include realistic costs, and compare filtered and unfiltered versions. The Kvants documentation explains the strategy and testing workflow.
The goal is not to discover a perfect indicator pair. It is to determine whether a clearly specified combination remains useful under realistic assumptions and outside the data used to refine it.
Kvants audits that the engine runs the strategy you configured.
Frequently Asked Questions
Are leading indicators better than lagging indicators?
No. Leading indicators provide earlier information at the cost of more false signals. Lagging indicators provide confirmation at the cost of delay. The appropriate choice depends on the strategy hypothesis, market regime, timeframe, and tolerance for premature or missed entries.
Is RSI a leading or lagging indicator?
RSI is commonly classified as leading because traders use momentum extremes and divergences to anticipate changes. However, it is calculated from historical prices. A rule that waits for RSI to recover above a threshold is confirmatory relative to the original extreme.
What is the simplest way to combine both types?
Use one broad trend filter and one responsive entry trigger. For example, permit long entries only above a rising moving average, then use a momentum-recovery rule as the trigger. Define risk and exit rules before testing.
Do more confirmations reduce false signals?
Sometimes, but they also reduce trade frequency and can delay entries. Correlated indicators may create an appearance of confirmation without adding independent information. Compare every added filter with a simpler baseline.
How should indicator settings be selected?
Start with settings that fit the timeframe and hypothesis, then test a limited range of nearby values. Prefer stable behavior across reasonable settings over one isolated result produced by a narrowly optimized parameter.
Can backtesting find the best indicator combination?
Backtesting can compare defined combinations under historical assumptions. It cannot identify a universally superior combination or establish that the strongest historical result will persist under future conditions.
Risk Note
This article is educational and is not investment advice. Indicators can fail, market conditions can change, and trading can result in substantial losses. Backtested performance does not guarantee future results. Kvants is a research tool, not an investment adviser, and does not guarantee performance.