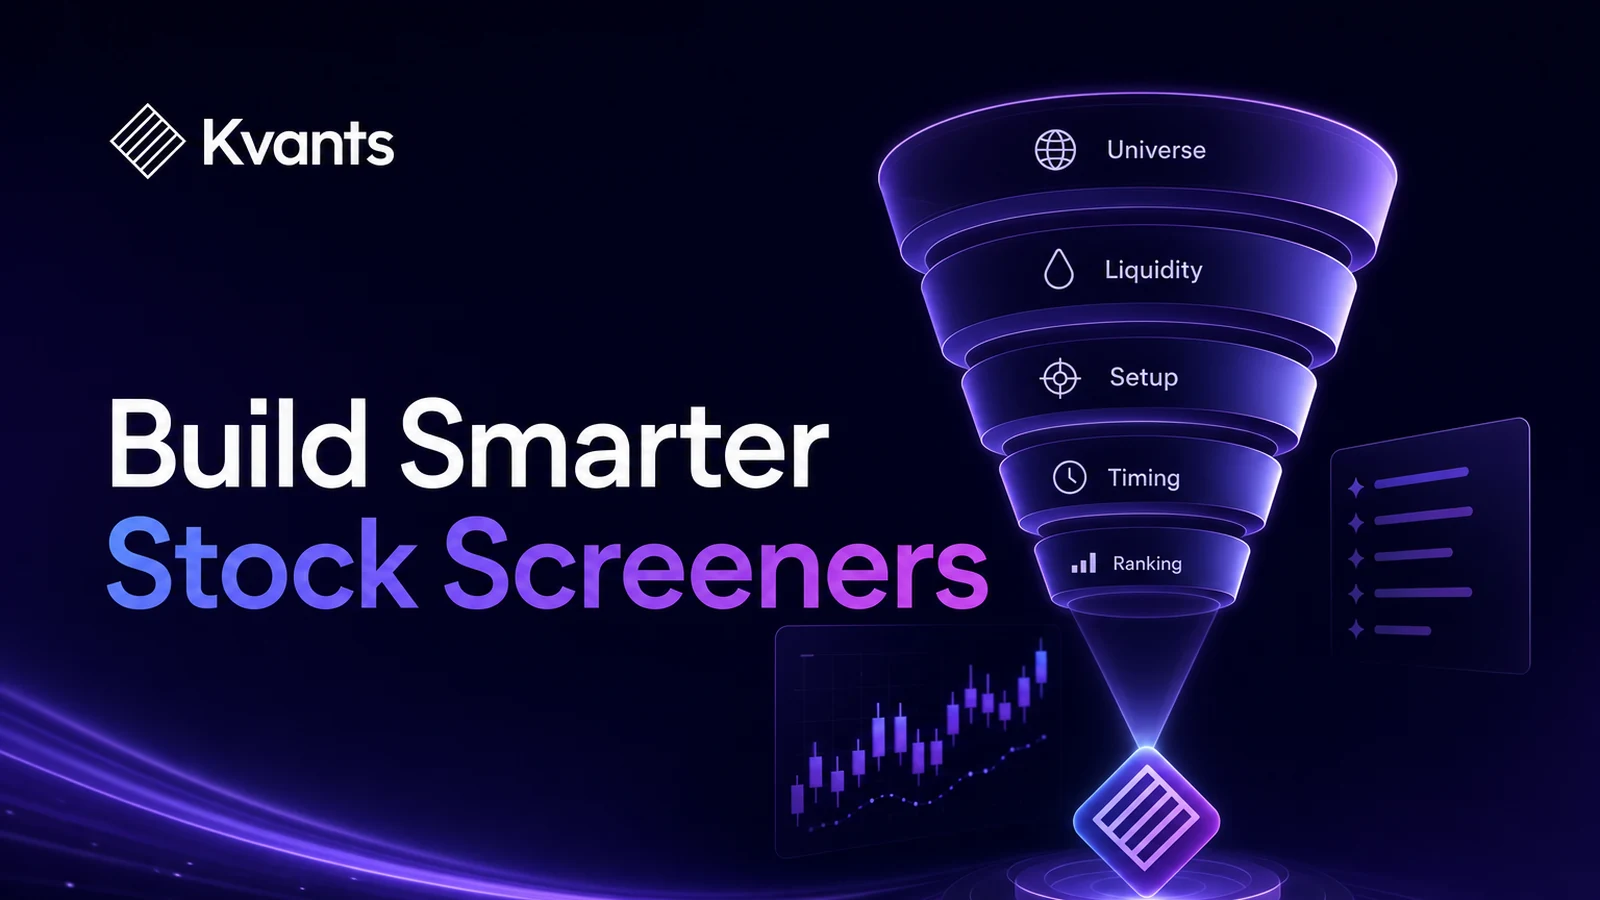
Learn how to build a stock screener using layered rules for universe, liquidity, setup, timing, and ranking—then test whether its signals are actually useful.
Quick Answer
To build a stock screener, start with the decision it must support and work backward. Define the eligible universe, remove instruments you cannot trade efficiently, identify the market condition behind the setup, add a timing rule, and rank the remaining candidates. Keep screening separate from execution and risk management. The main limitation is that a screener only narrows the opportunity set; it does not establish that the resulting trades have a durable edge.
Key Takeaways
- Give every filter one job: eligibility, tradability, setup, timing, exclusion, or ranking.
- Use values known at the screening time and calculate indicators from completed bars.
- Avoid stacking similar indicators that repeatedly measure the same condition.
- Define what happens after a stock passes the screen, including entry, exit, sizing, and costs.
- Backtest the complete decision process, not the screener in isolation.
What a Stock Screener Should Actually Do
A stock screener is a filtering system. It reduces a broad market universe to a smaller list of securities that meet predefined conditions.
That sounds simple, but many screeners are built without a clear decision in mind. A trader adds price, volume, moving-average, volatility, and pattern filters because each appears useful individually. The result may be a complicated list with no coherent market hypothesis.
A better screener answers a specific question, such as:
- Which liquid stocks are breaking above an established range?
- Which stocks in an uptrend have pulled back without invalidating that trend?
- Which volatile stocks have contracted enough to justify monitoring for expansion?
The screener does not need to predict what happens next. Its job is to identify situations in which a precisely defined trading decision may be considered.
Screening must also be distinguished from execution. A stock can pass a screen at the close without being tradable at that same closing price. If the signal uses closing data, a realistic strategy may need to enter at the next available price. That distinction matters when the screen is backtested.
How to Build a Stock Screener in Six Layers
Treat the screener as a funnel. Each layer should remove candidates for a clearly stated reason.
1. Define the eligible universe
Start by deciding what can enter the screen at all. Relevant constraints may include exchange, security type, country, price range, or membership in a defined stock universe.
The universe should match the strategy. A swing strategy intended for actively traded US stocks should not silently include illiquid securities from unrelated markets.
For historical testing, use point-in-time membership where possible. Testing only stocks that exist today introduces survivorship bias because failed, acquired, or delisted companies may disappear from the historical sample.
2. Apply tradability filters
A valid chart pattern is not necessarily executable. Price, trading activity, spreads, and position size all affect whether an apparent opportunity can be traded at a reasonable cost.
Common tradability measures include:
- Minimum share price
- Minimum average daily volume
- Minimum average daily dollar volume
- Maximum position size relative to normal trading activity
Dollar volume is calculated as price multiplied by share volume. It can be more informative than share volume alone when comparing stocks with very different prices.
Do not assume a universal liquidity threshold. A suitable level depends on account size, holding period, order type, and expected participation in the market.
3. Define the setup condition
The setup describes the market state you want to investigate. For a momentum screen, it might require the stock to trade above a long-term moving average and near a recent high. For a pullback screen, it might require an established uptrend followed by a controlled decline.
Every rule should connect to the same hypothesis. Combining an oversold reversal condition, a breakout condition, and an extreme trend-strength condition may produce a screen that is restrictive but conceptually confused.
Write the hypothesis before choosing indicators. For example:
Stocks already in an established uptrend may deserve attention when they close above a recent resistance level with stronger-than-normal activity.
The hypothesis does not claim the setup will work. It explains why the selected rules belong together.
4. Add a timing trigger
Setup and trigger are different.
A setup can remain valid for days or weeks. A trigger identifies the specific event that moves a stock onto the actionable list. Examples include a close above the highest high of the previous 20 completed sessions or a move back above a short-term moving average after a pullback.
Be exact about lookback windows. “Close above the 20-day high” should usually compare today’s close with the highest high of the preceding 20 completed bars—not a range that includes today. Including the current bar can change the meaning of the rule or make it impossible to satisfy.
5. Add exclusions sparingly
Exclusion rules remove cases in which the setup is undesirable or difficult to execute. A trader might exclude stocks with insufficient history, missing data, extreme one-day gaps, or prices outside the strategy’s intended range.
Each exclusion reduces the sample size. Too many exclusions can leave a strategy dependent on a small number of historical examples. Add an exclusion because it addresses a defined problem, not because it improves a backtest after inspection.
6. Rank the survivors
A screen may still return more candidates than you can trade. Ranking creates a consistent priority order.
Possible ranking variables include:
- Distance from the breakout level
- Recent return relative to the wider market or universe
- Volume relative to the stock’s own history
- Volatility adjusted for price
- Proximity to a predefined invalidation level
Choose a ranking measure that supports the hypothesis. If the strategy is about strong trends, ranking by trend strength is coherent. Ranking the same candidates by the lowest valuation introduces a different thesis and may require separate research.
Define tie-breaking rules as well. Otherwise, two runs of the same screen could produce different portfolios.
Worked Example: A Daily Momentum Screen
Consider an illustrative end-of-day screen designed to find liquid stocks making fresh intermediate-term highs. These values are examples for research, not recommended settings.
Screening rules
- The stock has enough historical data to calculate every indicator.
- The closing price is above a chosen minimum.
- Average dollar volume over the previous 20 completed sessions exceeds a chosen threshold.
- The closing price is above the 100-day simple moving average.
- The closing price is above the highest high of the previous 20 completed sessions.
- Candidates are ranked by their recent return relative to the eligible universe.
These rules create a candidate list, not a complete strategy. To make the idea testable, additional decisions are required:
- Signal time: Generate the signal after the daily bar is complete.
- Entry: Enter at the next session’s modeled execution price.
- Portfolio limit: Hold no more than a predefined number of positions.
- Sizing: Use an explicit equal-weight or risk-based rule.
- Exit: Define trend failure, stop, profit-taking, or maximum holding-period rules.
- Costs: Include commissions, spread assumptions, slippage, and applicable fees.
The example also needs a rule for excess candidates. If only five positions are permitted and 12 stocks pass, the ranking determines which five can enter. Without that step, the historical test is not reproducible.
A Step-by-Step Testing Workflow
Step 1: Freeze the first specification
Document the initial universe, formulas, lookback periods, ranking logic, and trade rules before examining detailed results. This creates a baseline and reduces the temptation to redesign the screen around historical winners.
Step 2: Audit data timing
Confirm that every input would have been available when the decision was made. Adjust price data consistently for corporate actions, avoid using future universe membership, and do not execute at a price that existed before the signal was observable.
Fundamental filters require particular care because publication dates and later revisions can differ from the period the data describes.
Step 3: Test the complete strategy
A screen’s quality cannot be judged from the subsequent returns of passing stocks alone. Simulate candidate selection, ranking, portfolio limits, entries, exits, position sizing, overlapping trades, and costs.
Evaluate more than total return. Relevant diagnostics include drawdown, turnover, trade count, exposure, concentration, average holding time, and the distribution of outcomes.
Step 4: Compare with simpler baselines
Remove one filter at a time. If eliminating a complex condition barely changes the results, the condition may add fragility rather than useful selectivity.
Also compare the screen with a simpler version of its core idea. A ten-filter momentum model should justify its complexity relative to a basic trend-and-breakout screen.
Step 5: Validate outside the design sample
Reserve later data or separate market periods for out-of-sample evaluation. Walk-forward testing can repeatedly fit or select parameters using past data and evaluate them on the next unseen segment.
Use parameter sweeps to inspect neighborhoods rather than hunt for one perfect value. A result that works only with a 47-day lookback but deteriorates at 45 or 50 days deserves skepticism.
Step 6: Review failure conditions
Test periods containing sharp selloffs, volatility shocks, gap-heavy markets, and changing leadership. The goal is not to prove that the screen survives every environment. It is to learn when turnover, drawdown, or execution demands may become unacceptable.
Common Stock Screener Failure Modes
Redundant filters
Price above several nearby moving averages may look like multiple confirmations, but each filter can measure nearly the same trend condition. Redundancy shrinks the sample without necessarily adding independent information.
Rules without a shared hypothesis
A screen assembled from popular indicators may have no consistent reason to exist. If you cannot explain why each condition belongs, separate the ideas and test them independently.
Accidental look-ahead bias
Using a completed closing price to generate a signal and assuming execution at that same close grants the simulation information that may not have been tradable in practice.
Ignoring portfolio capacity
A strategy that assumes every passing stock can be purchased may exceed available capital or create unrealistic exposure during broad market moves. Candidate limits, sizing, and ranking must be part of the test.
Optimizing for a clean equity curve
Repeatedly changing filters after reviewing results can fit historical noise. Prefer a defensible hypothesis, stable parameter regions, unseen evaluation periods, and realistic stress tests.
Turning the Screen into Auditable Rules
Plain-English screening ideas often hide ambiguity. Terms such as “liquid,” “strong trend,” and “high volume” need formulas, windows, thresholds, and precise timing before they can be tested.
Kvants Studio turns plain-English trading ideas into editable, auditable strategy logic. For supported stock price-and-volume rules, you can formalize the screen and its execution logic, run event-driven backtests on NautilusTrader’s engine, explore parameter ranges, and apply walk-forward or crisis-stress validation.
The useful objective is not to ask software to discover a perfect filter combination. It is to make assumptions visible and challenge them systematically. The Kvants documentation can help when translating a defined research idea into a testable workflow. Kvants also supports Pine Script v6 export and controlled paper or live workflows after research, but those stages do not replace independent validation or risk controls.
Frequently Asked Questions
How many filters should a stock screener use?
There is no ideal number. Use the fewest filters needed to define the universe, ensure tradability, identify the setup, and prioritize candidates. Every additional condition should solve a specific problem or represent a distinct part of the hypothesis.
Should liquidity be measured with volume or dollar volume?
Share volume shows how many shares trade, while dollar volume accounts for both price and volume. Dollar volume is often more comparable across differently priced stocks, but neither directly measures the spread or the market impact of your order.
Is a stock screener the same as a trading strategy?
No. A screener produces candidates. A complete strategy also defines signal timing, entry, sizing, portfolio limits, exits, execution assumptions, and costs. A promising screen can still lead to a poor strategy when these elements are included.
How often should a stock screener run?
The schedule should match the data and holding period. A strategy based on daily closing data may run after each completed session. Intraday screening requires more frequent updates and a more detailed treatment of latency, spreads, and execution.
Can I use fundamental and technical filters together?
Yes, if they support a coherent hypothesis and the historical fundamental data is point-in-time. Using later revisions or assuming data was available before its publication date can create look-ahead bias.
Risk Note
This article is educational and is not investment advice. Screening rules can fail, market relationships can change, and historical data may not reflect executable conditions. Backtested performance does not guarantee future results. Kvants is a research tool, not an investment adviser, and does not guarantee performance.