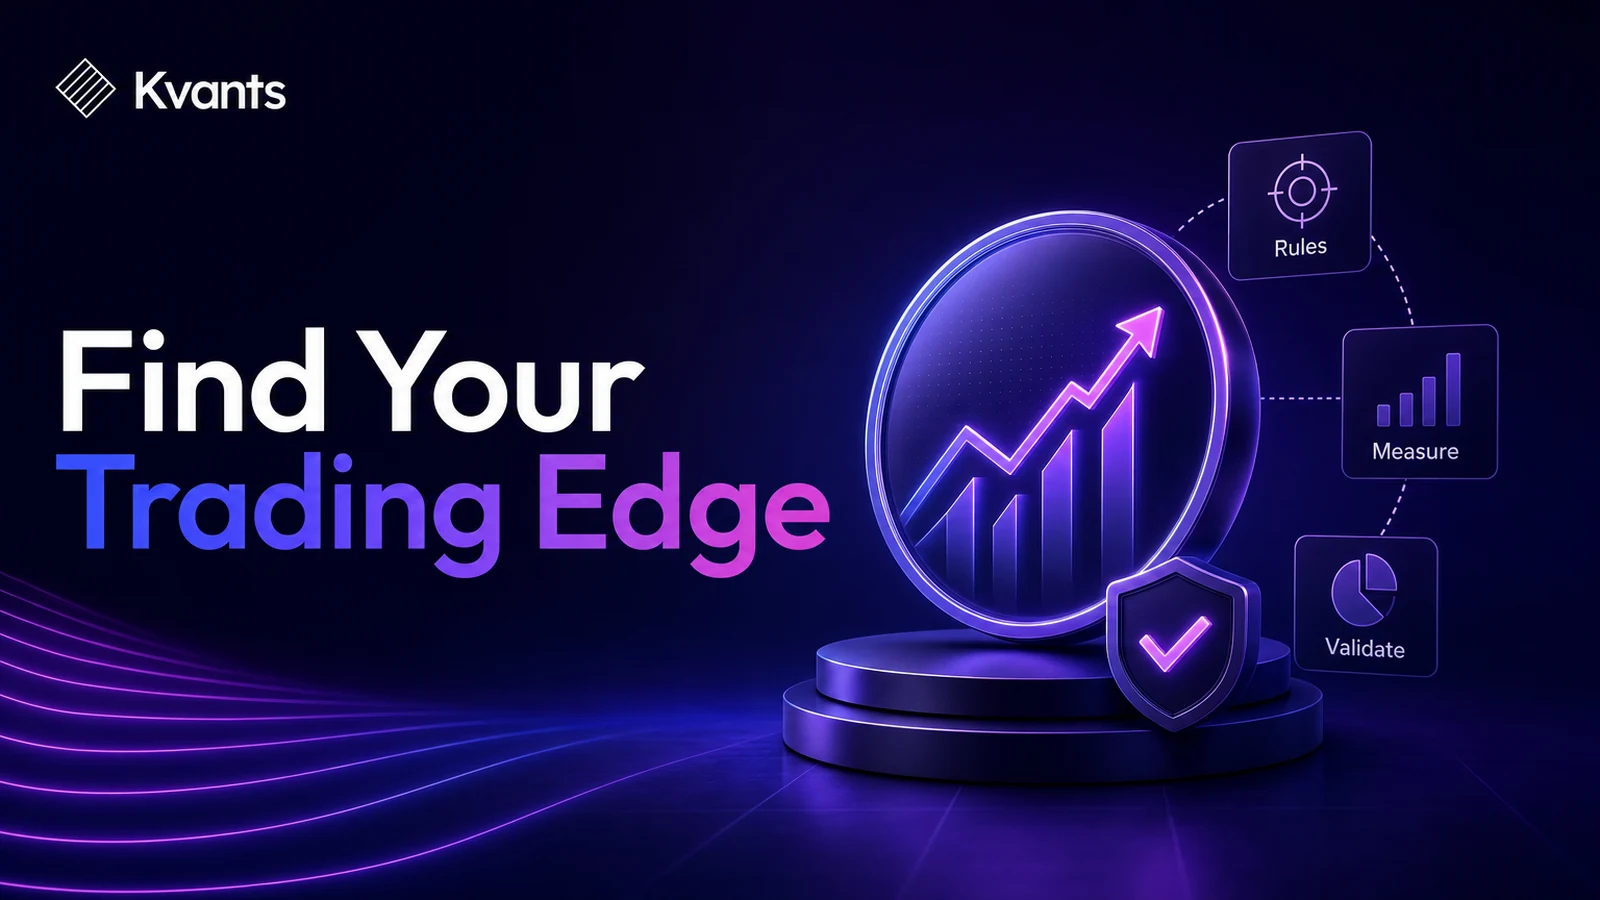
Learn how to find your trading edge by defining testable rules, measuring cost-adjusted expectancy, segmenting results, and validating the evidence out of sample.
Quick Answer
To find your trading edge, define one complete setup, collect trades generated by the same rules, calculate results after realistic costs, and identify the conditions responsible for performance. Then test those findings on data that was not used to discover them.
An edge is not a high win rate or an attractive equity curve. It is a repeatable, cost-adjusted advantage supported by enough relevant evidence to justify further testing. Even a valid historical edge can weaken as market conditions, costs, liquidity, or execution change.
Key Takeaways
- An edge must specify the market, setup, entry, exit, risk, timing, and execution assumptions.
- Measure expectancy after commissions, fees, spread, slippage, and other applicable costs.
- Segment results to discover where performance comes from, but treat every extra filter as a new hypothesis.
- Separate strategy performance from execution quality before changing the rules.
- Validate promising findings on untouched data and across different market conditions.
- Use live or paper-trading evidence to monitor whether tested assumptions survive real execution.
What a Trading Edge Actually Is
A trading edge is a conditional advantage: under defined circumstances, a repeatable process produces a favorable distribution of outcomes after costs.
The word conditional matters. A setup may work in liquid large-cap stocks during high-volume morning sessions but fail in thin markets or quiet afternoons. Averaging those situations together can either hide a useful edge or make an unreliable strategy look acceptable.
A usable edge has four parts:
- Defined rules: Another person could determine when the setup is valid without asking what you “felt” about the chart.
- Positive net expectancy: Average gains compensate for average losses and trading costs.
- Relevant evidence: The sample represents the instruments, sessions, regimes, and execution conditions you intend to trade.
- Operational fit: You can execute the strategy within your schedule, capital, risk limits, and technology constraints.
This is why copying someone else’s setup does not automatically transfer their edge. Differences in fills, holding periods, costs, position sizing, availability, and rule interpretation can produce a different outcome.
Every Kvants strategy keeps an evolving brain.
How to Find Your Trading Edge Step by Step
1. Turn the setup into a falsifiable hypothesis
Start with one narrow claim. For example:
After a stock breaks the first 30-minute high on elevated relative volume, entering on a close above the level and exiting at either a fixed stop or target produces positive net expectancy.
The claim does not have to be correct. It must be specific enough to test and disprove.
Define at least:
- Eligible instruments and liquidity requirements
- Data timeframe and trading session
- Setup conditions
- Entry trigger and order type
- Stop placement
- Profit-taking or other exit logic
- Maximum holding period
- Position-sizing rule
- Applicable costs and fill assumptions
- Rules for overlapping signals and open positions
“Buy strong breakouts” is an idea. It is not yet a measurable strategy.
2. Establish a clean baseline
Test the simplest defensible version before adding filters. A baseline reveals whether the core premise has evidence behind it.
If you begin with ten indicators and several exceptions, you will not know which condition contributes value. Complex rules also create more opportunities to fit historical noise.
Record more than net profit. Useful baseline measures include:
- Number of trades
- Win rate
- Average win and average loss
- Expectancy per trade
- Profit factor
- Maximum drawdown
- Consecutive losses
- Trade duration
- Exposure
- Results before and after costs
No single metric proves an edge. Each describes a different part of the outcome distribution.
3. Calculate net expectancy
A basic expectancy formula is:
Expectancy = (Win rate × Average win) − (Loss rate × Average loss)
If results are measured in units of initial risk, expectancy can be expressed in R:
Expectancy in R = Total net R ÷ Number of trades
Suppose a strategy wins 44% of its trades. Its average winner is 1.6R, while its average loser, including costs, is 0.9R:
(0.44 × 1.6R) − (0.56 × 0.9R) = 0.20R per trade
That positive value is a starting observation, not a promise. It does not show whether the result is stable, concentrated in a few trades, or likely to survive different conditions.
4. Segment performance without mining for answers
An overall average can conceal where an edge exists. Break results into categories that have a plausible relationship with the strategy:
- Market or instrument
- Long versus short
- Time of day
- Volatility regime
- Trend or range conditions
- Relative volume
- Setup subtype
- Entry method
- Holding period
Inspect both the result and the sample size for every segment. A subgroup with five strong trades is a research lead, not reliable evidence.
Segmentation also increases the risk of false discovery. If you inspect enough weekdays, indicators, thresholds, and sessions, something will look unusually good by chance. Any filter discovered through analysis should therefore be tested on untouched data.
5. Separate strategy edge from execution edge
A sound strategy can produce poor live results if it is not followed. Conversely, favorable discretionary execution can temporarily disguise weak strategy rules.
For each trade, preserve two records where possible:
- Model result: What should have happened under the written rules
- Actual result: What happened after your timing, sizing, fills, and discretionary decisions
The difference helps diagnose the problem. Repeated late entries suggest an execution issue. Losses taken exactly according to plan may reflect normal variance or a weak model rather than poor discipline.
Do not rewrite a strategy to accommodate every execution mistake. Improve the process that caused the deviation first.
6. Challenge the finding on new data
Once you identify a promising rule set, freeze it. Test it on a period or group of instruments that played no role in developing the strategy.
Look for persistence rather than an exact repeat of the original metrics. Ask:
- Does expectancy remain positive after costs?
- Is performance dependent on one instrument or brief period?
- Does drawdown remain operationally tolerable?
- Are results driven by a few extreme winners?
- Do small changes in parameters destroy the outcome?
Walk-forward testing can repeat this process across successive historical windows. Crisis-stress testing can show how the strategy behaved during unusually volatile periods. Neither guarantees future performance, but both make fragile assumptions easier to detect.
7. Forward test the frozen rules
Historical testing cannot fully reproduce live execution. Forward testing checks whether signals arrive as expected and whether practical issues change the result.
Use paper trading or minimal controlled exposure to evaluate:
- Signal timing
- Realistic spread and slippage
- Order rejections or partial fills
- Data availability
- Your ability to follow the process
- Differences between modeled and realized results
Set review criteria before starting. Otherwise, a short winning or losing run may influence the decision more than the evidence warrants.
Browsing tradeable signals in the research library.
Worked Example: Finding a Conditional Edge
Consider a hypothetical breakout strategy with 120 historical trades and net expectancy of +0.18R per trade.
The overall result appears promising, but segmentation reveals:
- 72 morning trades averaged +0.42R
- 48 afternoon trades averaged −0.18R
The weighted result is:
[(72 × 0.42R) + (48 × −0.18R)] ÷ 120 = +0.18R
This does not immediately prove that afternoon trading should be removed. The difference could reflect a particular market period, different instruments, or chance.
The next defensible step is to form a new hypothesis: the setup has positive expectancy only during the defined morning window. Freeze that window and test it on untouched data. Also verify that the rule was knowable before each trade and that costs were applied consistently.
If the morning effect persists, it may define where the edge operates. If it disappears, the original segment was probably unstable or overfit. The failed test is still useful because it prevents a weak filter from becoming a live trading rule.
Common Failure Modes
Starting with an undefined setup
If entries or exits depend on hindsight, the trade sample does not represent one repeatable process. Formalize ambiguous terms such as “strong momentum” or “clean structure” before interpreting the results.
Treating win rate as proof
A high win rate can coexist with negative expectancy when losses are much larger than gains. Evaluate the full payoff distribution after costs.
Ignoring execution costs
Small theoretical advantages are especially sensitive to spread, commissions, fees, slippage, and latency. A gross edge that disappears after reasonable costs is not operationally useful.
Adding filters until the history looks good
Every added threshold gives the strategy another way to fit noise. Prefer simple, explainable conditions and require new data to validate changes.
Confusing a drawdown with edge failure
A losing run alone does not prove that an edge has disappeared. Compare current performance with the strategy’s tested loss distribution, execution records, and market conditions before intervening.
Using irrelevant historical evidence
A large sample is not automatically representative. Data from different instruments, liquidity conditions, sessions, or rule versions may answer a different question from the one you intend to trade.
A strategy laid out end to end in the Kvants editor.
A Practical Edge-Validation Checklist
Before calling a strategy an edge, confirm that:
- The complete entry and exit process is written down.
- Rules use only information available at the decision time.
- Position sizing is consistent across the test.
- Costs and plausible fills are included.
- The result is not dependent on one outlier or short period.
- Segments were chosen for a defensible market reason.
- Newly discovered filters were tested on untouched data.
- Parameter changes produce understandable rather than chaotic results.
- Drawdowns fit your capital and risk constraints.
- Paper or controlled live results can be compared with the model.
An edge remains a working hypothesis. Monitoring is part of the process, not something that ends when the first backtest looks attractive.
Researching a Trading Edge With Kvants
Kvants Studio turns plain-English trading ideas into editable, auditable strategy logic. This can help expose vague conditions before they enter a test.
After reviewing the generated rules, traders can run event-driven backtests on stocks or crypto using NautilusTrader’s engine. Parameter sweeps can test whether a result survives reasonable changes rather than relying on one ideal threshold. Walk-forward and crisis-stress validation can then challenge the strategy across time and difficult market environments.
A validated hypothesis can be exported to Pine Script v6 or moved into a controlled paper or live workflow. Review the Kvants documentation before testing so that signal logic, assumptions, and outputs are interpreted correctly.
These tools reduce research friction, but they do not determine whether an idea is economically sound. The trader remains responsible for the hypothesis, data relevance, risk limits, and final interpretation.
Frequently Asked Questions
How many trades do I need to confirm a trading edge?
There is no universal number. The required evidence depends on trade frequency, payoff variability, market diversity, and how narrow the claimed edge is. Treat small samples as preliminary and focus on whether the result persists across relevant, untouched data.
Can a strategy have an edge with a low win rate?
Yes. A low-win-rate strategy can have positive expectancy if its average winners sufficiently exceed its average losses and costs. It may still be difficult to execute because long losing sequences can occur.
How do I know whether my edge has disappeared?
Check whether rules were followed, costs or fills changed, and current market conditions match the tested environment. Then compare recent results with historical variation. A short drawdown is insufficient evidence, but persistent deterioration beyond tested expectations deserves investigation and reduced risk.
Should I optimize a strategy before forward testing it?
Only enough to produce a coherent, defensible rule set. Extensive optimization on the same data increases overfitting risk. Prefer broad, stable parameter regions, freeze the chosen rules, and evaluate them on untouched data before forward testing.
Is discretionary trading compatible with data analysis?
Yes, but discretionary decisions must be categorized consistently. Define the context, permitted decisions, and invalidation rules, then record why each decision was made. If a judgment cannot be described or tagged consistently, its contribution will be difficult to evaluate.
Risk Note
This article is educational and is not investment advice. Trading involves risk, including the possible loss of capital. Backtested performance does not guarantee future results, and historical relationships may weaken or disappear as market structure, liquidity, costs, and participant behavior change. Kvants is a research tool, not an investment adviser, and does not guarantee performance.