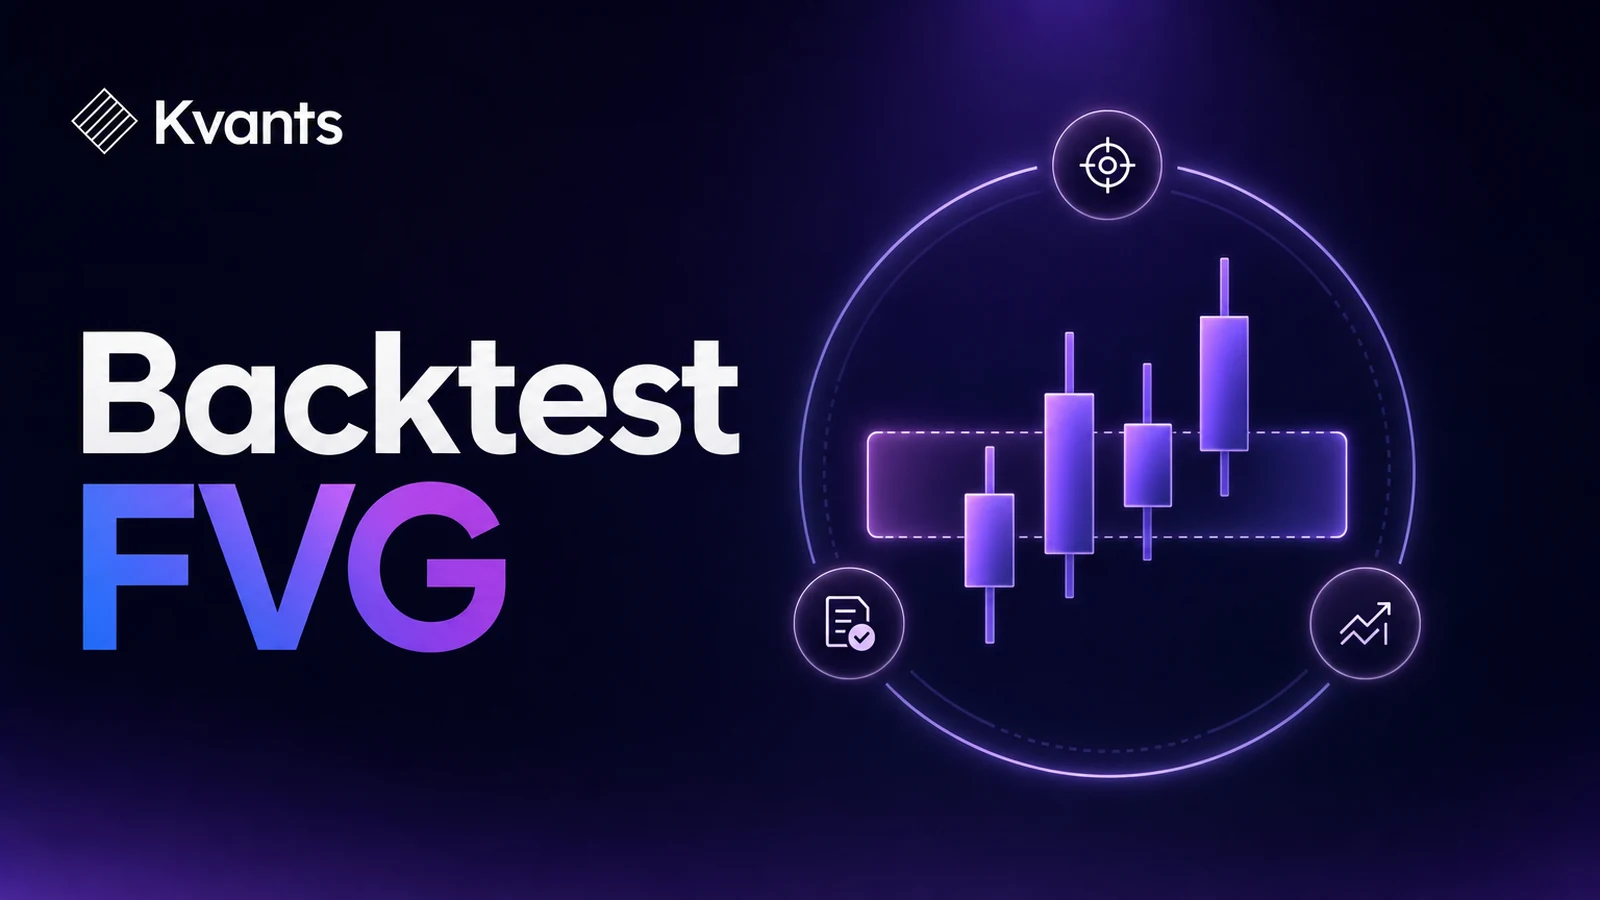
Learn how to backtest a fair value gap strategy by defining objective detection, entry, stop, target, timing, and execution rules before evaluating results.
Quick Answer
Fair value gap backtesting starts by replacing visual judgment with explicit rules. Define the three-candle pattern mathematically, when the gap becomes known, how large it must be, what counts as a revisit, and exactly when an order can fill. Then specify the stop, target, costs, session, and position sizing before running the test.
The main limitation is that “fair value gap” is not one universally standardized signal. Small changes in gap detection, entry timing, or intrabar assumptions can produce materially different results, so every definition must remain visible and auditable.
Key Takeaways
- Define bullish and bearish gaps using exact candle-price relationships.
- A gap should not become tradable until the confirming candle has closed.
- Separate signal detection from entry, fill, stop, and target events.
- Test entry variants independently instead of choosing one after seeing results.
- Include fees, slippage, session boundaries, and unfilled orders.
- Treat a promising backtest as a research result, not proof of future performance.
What Makes a Fair Value Gap Testable?
A fair value gap, or FVG, is commonly represented by a three-candle sequence in which the first and third candles do not overlap across part of their ranges.
One objective definition is:
- Bullish FVG: the low of candle three is above the high of candle one.
- Bearish FVG: the high of candle three is below the low of candle one.
For a bullish pattern, the gap zone extends from candle one’s high to candle three’s low. For a bearish pattern, it extends from candle three’s high to candle one’s low.
That definition detects a price pattern. It does not yet define a strategy. A complete strategy must answer several additional questions:
- Does candle two need a minimum body size or range?
- Must the pattern occur after a liquidity sweep or structure break?
- How large must the gap be relative to price, tick size, or volatility?
- How long does the gap remain valid?
- Does any touch count as mitigation, or must price reach the midpoint?
- Is the entry a resting limit order or a confirmation-based market order?
- Where are the stop and target placed?
If two traders answer these questions differently, they are testing different strategies even if both call the setup an FVG.
A Rule Sheet for Fair Value Gap Backtesting
Write the strategy as a specification before looking at its results. The following rule sheet covers the decisions most likely to change a test.
| Component | Example objective rule |
|---|---|
| Market | One named stock or crypto trading pair |
| Timeframe | Five-minute bars |
| Bullish gap | Candle three low is greater than candle one high |
| Confirmation time | Pattern exists only after candle three closes |
| Minimum size | Gap width exceeds a defined number of ticks or volatility fraction |
| Context | Price is above a separately defined trend filter |
| Entry | Limit order at the gap midpoint on the first revisit |
| Expiry | Cancel after a fixed number of bars or at session end |
| Stop | Below a predefined structural level or fixed distance |
| Target | Fixed R-multiple, structural target, or explicit exit signal |
| Risk | Fixed fraction of research equity per accepted trade |
| Costs | Fees plus a stated slippage model |
The purpose of the rule sheet is not to identify the “correct” FVG interpretation. It is to ensure that the same interpretation is applied to every eligible historical event.
Prevent confirmation leakage
A three-candle gap is not confirmed at the start of candle three. Its final high and low are only known when that candle closes.
If a backtest identifies the completed pattern and also enters earlier within candle three, it has used information that was unavailable at the decision time. This is look-ahead bias.
A conservative sequence is:
- Candle three closes.
- The strategy confirms the gap.
- An order becomes eligible on the next event.
- The engine evaluates whether later prices could fill that order.
A strategy using live intrabar data can follow a different sequence, but the test must model the information and events that would actually have been available.
Define mitigation precisely
“Enter when price returns to the gap” can mean several things:
- first touch of the nearest boundary;
- entry at the midpoint;
- full traversal to the far boundary;
- a close inside the zone;
- a rejection candle formed after the revisit.
These rules create different entry prices and trade counts. Test them as separate variants. Do not mix them into one dataset or switch definitions after inspecting losing trades.
A backtest's equity curve and trade-by-trade log.
Worked Example: A Bullish FVG Strategy
Consider a hypothetical three-candle sequence on five-minute data:
- Candle one high: 100.00
- Candle three low: 100.40
- Confirmed bullish gap: 100.00 to 100.40
- Gap midpoint: 100.20
The strategy places a buy limit at 100.20 only after candle three has closed. The order expires after six bars. If filled, the stop is 0.50 below the entry at 99.70, and the target is 1.00 above the entry at 101.20. Before costs, that represents 0.50 of planned risk and 1.00 of planned reward, or a 2R target.
This example still requires execution rules. Suppose a later bar has a low of 99.60 and a high of 101.30. Bar data shows that the entry, stop, and target prices all traded, but it does not reveal their sequence.
A backtest must not automatically select the favorable outcome. It should use finer-resolution data, an explicit intrabar model, or a conservative ambiguity rule. This is one reason event sequencing matters for gap strategies with relatively tight price levels.
The example also distinguishes an unfilled setup from a losing trade. If price never reaches 100.20 before expiry, no position exists. Counting that setup as a win because price later rose would overstate the strategy’s opportunity set.
Step-by-Step FVG Validation Workflow
1. Freeze one baseline definition
Choose the gap formula, timeframe, market, direction, minimum width, and confirmation time. Save this version before testing filters or alternative entries.
2. Specify the complete order lifecycle
Document when the order is submitted, its type, its price, when it expires, and what cancels it. Define how gaps through a limit or stop are handled.
3. Normalize gap size
A fixed price threshold may behave differently across assets or volatility regimes. Consider expressing gap width in ticks, basis points, percentage terms, or as a fraction of a volatility measure. Use only information available at signal time.
4. Add costs and realistic constraints
Model applicable fees and a defensible slippage assumption. Apply trading-session rules, minimum order sizes, price increments, and position-sizing limits relevant to the market being studied.
5. Audit individual trades
Inspect examples from winners, losers, unfilled signals, session boundaries, and unusually volatile periods. Confirm that the detected zone, decision time, order, and exit follow the written rules.
6. Test variations without mining for a winner
Parameter sweeps can compare gap size, expiry, entry depth, and exit rules. Prefer broad, stable behavior over one isolated setting with unusually favorable historical results. Keep a record of how many variants were tested.
7. Validate outside the development sample
Reserve data that was not used to design the rules. Walk-forward testing can repeatedly develop on earlier periods and evaluate on later ones. Crisis or regime stress tests can reveal dependence on calm, trending, or highly volatile conditions.
8. Move to observation before deployment
Paper testing helps determine whether signals, orders, and fills behave as expected on incoming data. If the strategy advances further, use controlled exposure and predefined pause conditions rather than treating the backtest as a forecast.
Configuring a backtest in Kvants Studio.
Common Failure Modes
Coding the label instead of the definition
“Bullish FVG” is a concept label, not executable logic. Every candle relationship, threshold, and exception must be explicit.
Entering before confirmation
Using candle three’s completed range while assuming an earlier fill introduces future information.
Ignoring overlapping gaps
Several active zones may exist simultaneously. Define whether all remain eligible, only the newest survives, or one position can be opened at a time.
Silently changing the setup with context
A trader may accept one pattern after a sweep but reject the same geometry elsewhere. If context matters, encode the sweep or structural condition rather than applying it retrospectively.
Optimizing filters together
Searching many sessions, gap widths, trend filters, targets, and expiry periods can uncover a combination that fits noise. Change small groups of parameters, preserve out-of-sample data, and document the search.
Evaluating only win rate
Win rate omits payoff size, costs, drawdowns, exposure, and the distribution of outcomes. Review expectancy, average win and loss, trade frequency, maximum adverse movement, drawdown behavior, and results across periods.
Implementing Inspectable FVG Logic in Kvants
After the strategy has been fully specified, Kvants Studio can turn a plain-English idea into editable, auditable logic. That matters for FVG research because the generated definition can be inspected rather than treated as an unexplained chart label.
Kvants supports stock and crypto research on NautilusTrader’s event-driven engine. Researchers can test parameter variations, conduct walk-forward and crisis-stress validation, and move through controlled paper or live workflows. Pine Script v6 export is also supported when external chart review is useful.
Before trusting aggregate metrics, compare the implemented conditions with your rule sheet and audit individual events. The broader Kvants documentation can help clarify the available research workflow. The tool accelerates implementation and testing, but the researcher remains responsible for definitions, assumptions, and interpretation.
Kvants audits that the engine runs the strategy you configured.
Frequently Asked Questions
Does every fair value gap need to be filled?
No. A fair value gap is a detected price pattern, not a rule that price must revisit or fully traverse the zone. A backtest should measure how often the chosen revisit condition occurs rather than assume that every gap fills.
What is the best FVG entry rule?
There is no universal best entry. Boundary touch, midpoint, full mitigation, and confirmation entries trade off fill frequency, entry price, and delay. Define each variant independently and evaluate it across unseen periods and relevant market conditions.
Should an FVG strategy require a market structure shift?
Only if structure is part of the strategy hypothesis. If it is, define swing points, break thresholds, confirmation timing, and direction objectively. Adding an undefined structure filter simply reintroduces discretion.
What timeframe should be used for FVG backtesting?
Use a timeframe that matches the intended decision and holding horizon, then obtain sufficient resolution to model fills and same-bar exits. Lower timeframes create more observations but can increase sensitivity to spread, slippage, and data quality.
How many trades are enough for an FVG backtest?
There is no reliable universal number. The required evidence depends on outcome variability, trade frequency, market coverage, and how many strategy variations were tried. More trades do not repair biased rules, unrealistic fills, or a non-representative sample.
Can fair value gaps be backtested without coding?
Yes. A no-code or plain-English workflow can create the initial logic, but the resulting rules still need inspection. Verify the candle indexing, confirmation time, order behavior, costs, and exits before treating the output as valid evidence.
Risk Note
This article is educational and is not investment advice. Trading involves risk, including the risk of loss. Fair value gap behavior can change across assets, timeframes, liquidity conditions, and market regimes. Backtested performance does not guarantee future results, and simulated fills may differ from live execution. Kvants is a research tool, not an investment adviser, and does not guarantee performance.