Learn how to turn a visual bull flag into objective detection, entry, stop, target, and timing rules—then backtest the setup without hindsight or unrealistic fills.
Quick Answer
Bull flag backtesting requires replacing the visual pattern with measurable rules for the prior advance, consolidation, breakout, entry, stop, and exit. The backtest must detect the setup using only information available at that moment and must include realistic fees, slippage, and order timing. The main limitation is that no single definition represents every bull flag traders draw by eye. You are testing one explicit interpretation of the pattern, not proving that all bull flags work.
Key Takeaways
- Define the flagpole and consolidation with percentages, bars, and volatility measures rather than visual labels.
- Detect a breakout only after the flag has formed; do not use later candles to validate an earlier setup.
- Specify whether entry occurs at the breakout price, the next bar, or on a retest.
- Test ranges of plausible parameters instead of optimizing one perfect configuration.
- Include failed breakouts, trading costs, gaps, and overlapping signals in the results.
- Judge the strategy by expectancy, drawdown, stability, and sample size—not win rate alone.
Why a Visual Bull Flag Is Not Yet a Strategy
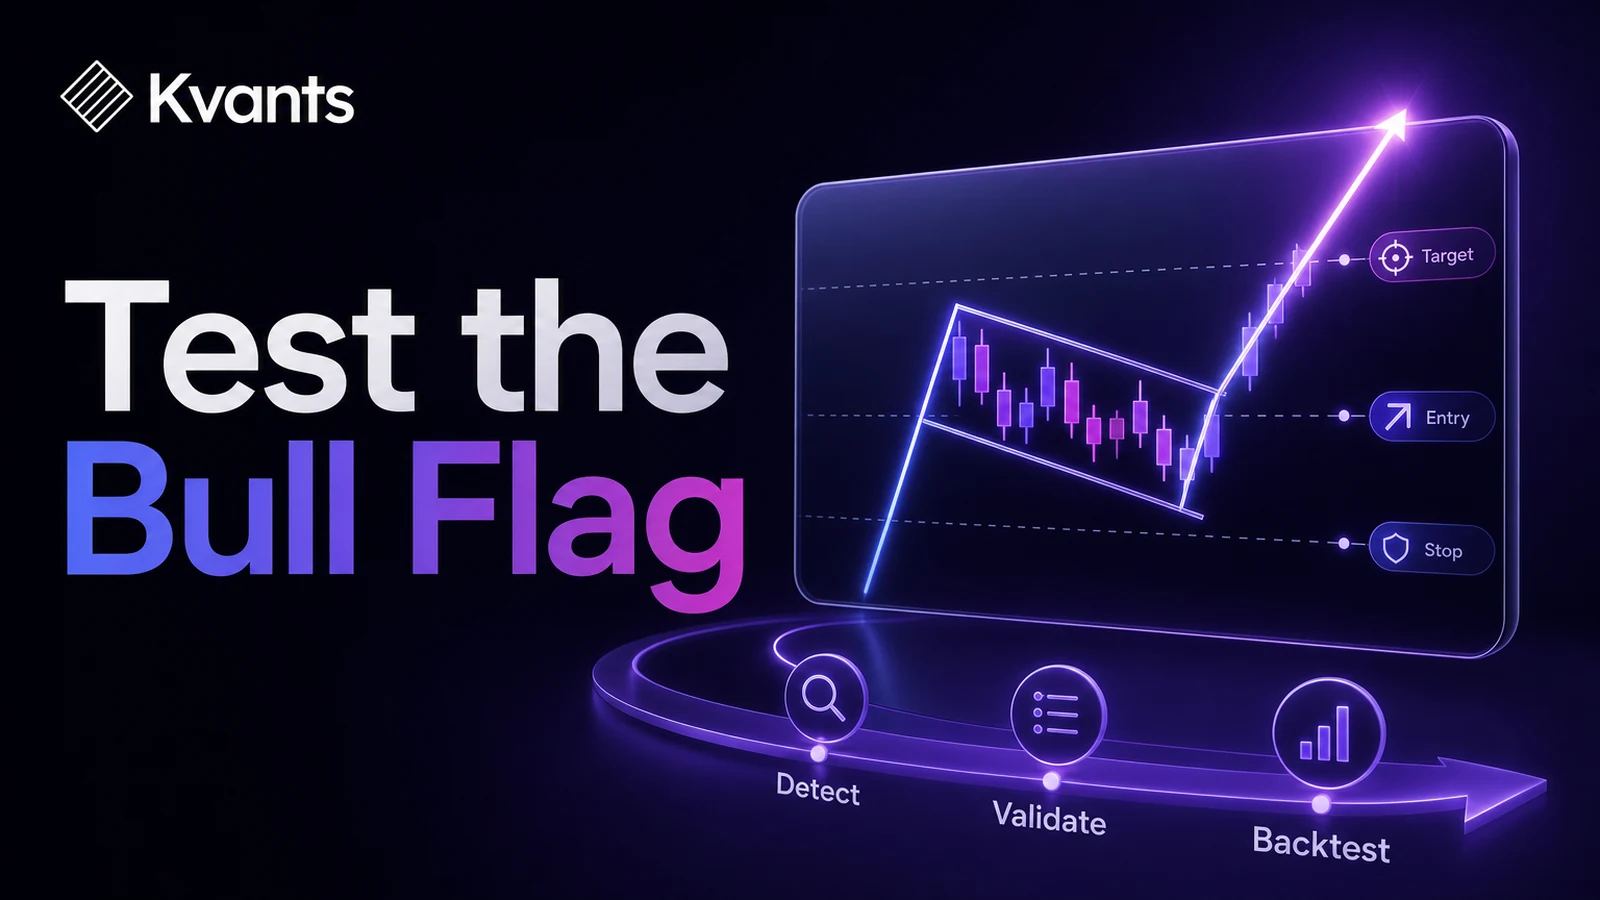
A bull flag is generally described as a strong upward move followed by a controlled consolidation and then a possible continuation higher. The initial advance is called the flagpole. The consolidation is the flag.
That description is useful for chart reading but insufficient for backtesting. Terms such as “strong,” “controlled,” and “breakout” can mean different things to different traders. They may even mean different things to the same trader after the outcome is visible.
An objective test needs to answer questions such as:
- How far and how quickly must price rise to create a flagpole?
- How many bars may the consolidation last?
- How deep may the pullback become?
- Must the flag slope downward, or can it move sideways?
- What price defines the breakout level?
- When is the order submitted and filled?
- What invalidates the setup?
Without those definitions, a backtest can quietly select attractive historical examples while excluding ambiguous or failed patterns. That is hindsight classification, not a reproducible strategy test.
A Testable Bull Flag Backtesting Specification
There is no universal bull flag definition. The following rule sheet is a starting hypothesis that can be adjusted for the market and timeframe being researched.
1. Define the flagpole
Require price to rise by at least a chosen percentage over a maximum number of bars. For example:
- The close rises at least 6% over five bars.
- The final close is above a longer-term moving average.
- The advance exceeds a volatility threshold, such as a multiple of average true range.
A percentage threshold is easy to understand, while a volatility-adjusted threshold adapts better across instruments with different behavior. Whichever method you choose, calculate it without referencing future bars.
2. Define the consolidation
The flag begins after the pole is complete. Possible rules include:
- Duration: three to eight completed bars.
- Maximum retracement: no more than 50% of the flagpole.
- Minimum retracement: optional, if tiny pauses should be excluded.
- Price containment: every flag close remains below the pole high until breakout.
- Structure: the consolidation range remains narrower than the pole range.
If downward slope matters to the hypothesis, define it mathematically. For example, require the last flag close to be below the first flag close. Do not ask the backtest to infer whether the pattern “looks right.”
3. Define the breakout
A simple breakout rule is a close above the highest high of the completed flag. A more aggressive version triggers when price trades above that level intrabar.
These are different strategies. A close-confirmed breakout reacts later but avoids assuming that every brief trade above resistance was actionable. An intrabar stop order may enter earlier, but the model must account for gaps and slippage.
Optional confirmation rules might require the breakout range or volume to exceed a recent baseline. Such filters should be treated as hypotheses, not automatic improvements.
4. Define risk and exits
Common stop locations include:
- Below the lowest low of the flag.
- A fixed volatility distance below entry.
- A percentage below entry.
Possible exits include a fixed reward-to-risk target, a trailing stop, a time exit, or a close below a trend filter. The stop and target must be known when the trade is opened if the strategy claims to use predetermined levels.
Also define what happens if the stop and target are both touched within one bar. Bar data alone may not reveal which occurred first. A conservative assumption, lower-timeframe data, or an event-driven simulation can reduce misleading results.
A backtest's equity curve and trade-by-trade log.
Worked Example: From Pattern to Orders
Assume a daily stock strategy uses these illustrative rules:
- Price closes at least 6% higher over the previous five sessions.
- A consolidation then lasts between three and six completed sessions.
- Its lowest low retraces no more than 50% of the pole.
- No consolidation close exceeds the pole high.
- Entry occurs with a buy-stop one tick above the consolidation high on the next session.
- The stop is placed below the consolidation low.
- The target is two times the initial risk.
- Any untriggered order expires after three sessions.
- An open position exits after ten sessions if neither stop nor target is reached.
Suppose the pole runs from 100 to 108. The flag trades between 104.50 and 107.50 for four completed sessions. The pullback is 3.50, or 43.75% of the eight-point pole, so it passes the 50% limit.
The buy-stop is placed just above 107.50. If the modeled fill is 107.60 and the stop is 104.40, initial risk is 3.20 per unit. A two-risk target would be 114.00.
Position size should be calculated from the chosen account-risk limit divided by risk per unit, subject to liquidity and exposure constraints. If the next session opens at 109, the test should not report a fill at 107.60. The order would be exposed to a gap, so the execution model must apply the defined gap-fill rule.
This example is not a recommendation. Its purpose is to show that every stage can be translated into information available before the outcome is known.
Step-by-Step Validation Workflow
Step 1: Freeze the initial rules
Write a versioned specification before viewing performance. Record the universe, timeframe, date range, corporate-action handling, entry timing, exits, fees, slippage, and position-sizing method.
Step 2: Inspect detected examples
Plot a sample of qualifying and rejected patterns. This is not an invitation to remove losing trades. It is a check that the implementation matches the written definition and that split adjustments, missing bars, or session boundaries are not creating false setups.
Step 3: Run a baseline test
Measure trade count, expectancy, average win and loss, maximum drawdown, exposure, holding time, and results after costs. Break results down by instrument and period so one asset or short market regime cannot hide weak general behavior.
Step 4: Test nearby parameters
Vary the pole threshold, formation length, retracement limit, breakout rule, and exit method across reasonable ranges. The goal is not to find the highest historical return. Look for neighborhoods where conclusions remain broadly stable.
Step 5: Separate development from evaluation
Develop the rules on one segment and evaluate them on untouched data. Walk-forward analysis can repeat this process through time. If the strategy repeatedly requires new parameters to survive each period, it may be fitting noise rather than capturing durable behavior.
Step 6: Stress execution assumptions
Increase fees and slippage, delay entry, worsen gap fills, and resolve ambiguous same-bar exits conservatively. A result that disappears under modest friction may not be practically tradable.
Step 7: Paper trade the final specification
Use paper trading to verify signal timing, order behavior, data availability, and operational discipline. Paper execution still cannot reproduce every live fill, but it can reveal implementation differences that a historical test misses.
A strategy laid out end to end in the Kvants editor.
Common Bull Flag Backtesting Failure Modes
Using the final flag boundaries too early
A consolidation high is not final until the chosen flag window is complete. Using a high or low established by future bars to trigger an earlier trade introduces look-ahead bias.
Keeping only textbook examples
Real detection rules will find awkward formations and failed breakouts. Excluding them after seeing their outcomes overstates the strategy’s historical quality.
Assuming fills at the breakout level
Markets can gap through stop orders. Thin instruments may also fill above the trigger. Model the order type and execution rule rather than assigning the ideal breakout price.
Optimizing every threshold together
Searching many pole lengths, retracement limits, volume filters, stops, and targets increases the chance of finding a configuration that fits historical noise. Keep the hypothesis simple and reserve untouched data for evaluation.
Ignoring repeated or overlapping signals
One extended formation may trigger several similar signals. Define whether new entries are allowed while a position is open and whether the same pole can generate another setup.
Treating a high win rate as sufficient
A strategy can win frequently and still lose if its failures are much larger than its winners. Review expectancy, payoff distribution, drawdown, costs, and concentration alongside win rate.
Implementing the Rules in Kvants
A plain-English specification like the one above can be entered into Kvants Studio and converted into editable, auditable strategy logic. The important step is still reviewing that logic to confirm the generated rules match the intended information timeline.
Kvants supports stock and crypto research on NautilusTrader’s event-driven backtesting engine. Traders can use parameter sweeps to examine nearby definitions, then apply walk-forward and crisis-stress validation rather than relying on one optimized backtest. A completed strategy can also be exported to Pine Script v6 for independent chart inspection.
The Kvants documentation can be used when configuring the research workflow. These tools reduce implementation friction, but they do not decide whether a bull flag hypothesis is valid or eliminate the need for careful assumptions.
Kvants audits that the engine runs the strategy you configured.
Frequently Asked Questions
What is the best timeframe for bull flag backtesting?
There is no universally best timeframe. Daily bars may produce fewer signals and simpler execution assumptions, while intraday bars create more observations but require careful session, spread, latency, and liquidity modeling. Test the timeframe you could realistically trade.
Does a bull flag need declining volume?
Not by definition. Declining consolidation volume and expanding breakout volume can be tested as filters, but they should not be assumed to improve results. Define the volume baseline precisely and compare filtered results with an otherwise identical baseline.
How many bull flag trades are enough?
There is no fixed number that guarantees a reliable conclusion. More independent observations generally reduce uncertainty, but hundreds of highly correlated trades may contain less information than a smaller sample spread across instruments and regimes. Examine confidence, concentration, and out-of-sample behavior.
Should entry occur intrabar or after the breakout close?
That depends on the strategy. An intrabar stop entry reacts sooner but is more sensitive to gaps, temporary breakouts, and slippage. A close-confirmed entry has clearer confirmation but enters later. Backtest both as separate, fully specified variants.
Can bull flags be tested in stocks and crypto?
Yes, but the same parameters should not be assumed to transfer. Trading hours, gaps, volatility, liquidity, fees, and market structure differ. Validate each market separately with appropriate data and execution assumptions.
What should invalidate a bull flag setup?
Possible invalidations include excessive retracement, consolidation beyond the maximum duration, a close below the flag low, or failure to trigger before order expiry. Choose the rule before testing and apply it consistently.
Risk Note
This article is educational and is not investment advice. Bull flag definitions, backtests, and worked examples are research tools, not trade recommendations. Backtested performance does not guarantee future results. Market conditions, liquidity, costs, gaps, and execution can cause live outcomes to differ materially from simulations. Kvants is a research tool, not an investment adviser, and never guarantees performance.